Did you know vacant land supply can quietly destroy your capital growth?
Most investors have heard that “too much development” hurts prices — but almost nobody can quantify it.
I can.
After analysing every bought-and-sold property in Australia for the past 30 years, I’ve been able to put real numbers behind this effect — and they’re bigger than most people expect.
If you want the full charts, examples, and methodology, I’ve put everything into a clear explainer video.
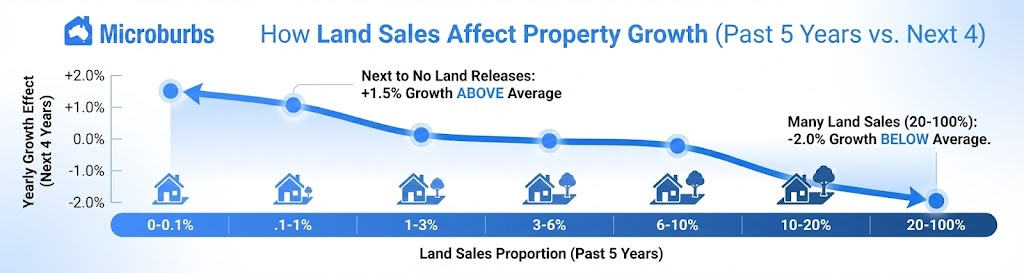
The Key Finding
Looking at five-year periods of sales:
- Suburbs with <0.1% vacant land sales
→ Outperform the national average by +1.5% per year - Suburbs with ≥20% vacant land sales
→ Underperform by –2% per year
That gap compounds into tens—or even hundreds—of thousands of dollars over time.
And it’s not just the suburb itself…
The 7 km Radius Effect
Even if your suburb has low land supply, being within 7 km of an area that’s releasing lots of land reduces your growth.
Supply doesn’t just affect the suburb it’s in — it affects the whole region around it.
Why the Effect Changes With Distance From a CBD
Close to a major city:
- Amenities are already maxed out
- New supply competes directly with existing homes
- Extra land = extra downward pressure
But 150 km or more from a CBD, new development often increases amenity, making the town more attractive and boosting long-term growth.
Context matters just as much as quantity.
Two Real-World Case Studies
1. Bulgarra, WA
2011–2014: ~20% of all sales were vacant land
→ Existing homes underperformed the national average by ~20%
→ Recovery only began once land supply dried up
→ Same pattern appears in other WA mining towns
2. Geraldton, WA
2010–2013: another ~20% land-sale period
→ Growth collapsed into the –3% to –5% per year range
→ Even when land sales dropped to ~15%, recovery took years
Both examples are charted clearly in the explainer video.
Why This Happens
It’s simple supply vs demand:
- More land → more new houses
- Buyers shift attention to new builds
- Existing homes face increased competition
- Demand thins out
- Price growth slows — or reverses
- Effect lasts until the excess supply is absorbed
This pattern repeats everywhere the numbers are high.
How to Protect Your Capital Growth
✔️ 1. Check the proportion of vacant land sales
<5% is fine.
10% is caution.
≥20% is a major risk signal.
✔️ 2. Check the surrounding suburbs (7 km rule)
Your suburb might be fine — its neighbours might not.
✔️ 3. Ask agents about upcoming land releases
They rarely volunteer the information.
✔️ 4. Favour constrained-supply areas
This is one major reason Sydney structurally outperforms Melbourne:
Sydney has no spare land.
✔️ 5. Don’t trust raw median price growth
Areas with lots of new builds often show fake growth that doesn’t apply to existing homes.
I’ll have a dedicated video on this soon.