# Step 4: Property Due Diligence
## How to Answer "Is This Property Worth Pursuing?" With Comprehensive Analysis
*This is Part 4 of a 4-part series on the data-driven property research workflow.*
---
## The Final Question
You've found a property that looks promising. It's in a suburb with strong fundamentals (Step 1), located in a pocket that passed your risk screens and shows good characteristics (Step 2), and it met all your search criteria (Step 3).
Now comes the question that determines whether you make an offer: is this specific property worth pursuing?
This is the due diligence phase. Unlike the previous steps, which narrowed options systematically, Step 4 is deep analysis of individual properties. You're no longer screening—you're investigating.
Property Reports provide the data foundation for this investigation. They answer questions you can't answer from a listing photo or a sales brochure, and they surface issues that might only become apparent after you've bought—unless you check now.
---
## The Critical Distinction: Suburb Reports vs. Property Reports
Before diving into the details, you need to understand why Property Reports exist separately from Suburb Reports.
### The Suburb Boundary Problem
A Suburb Report shows data within the suburb boundary. Every metric, every overlay, every analysis is bounded by where the suburb officially begins and ends.
But property value isn't bounded by administrative lines. A house on the edge of Suburb A might be more affected by what's in Suburb B than by what's in the rest of Suburb A.
Consider a property right on a suburb boundary:
- The Suburb Report for its address shows the pocket to the west
- But to the east, just across the suburb line, is a public housing estate
- The Suburb Report doesn't show this because it's "in another suburb"
- Yet it's 200 metres from the property and absolutely affects its value
### The Radius Solution
Property Reports solve this by showing data in a radius around the specific address. They don't care about suburb boundaries—they show what's actually nearby.
The Property Report for that same boundary property would show:
- The pocket to the west (same as Suburb Report)
- AND the public housing estate to the east (which the Suburb Report missed)
This is a fundamental difference. Suburb Reports answer "what is this suburb like?" Property Reports answer "what is the micro-environment around this specific property?"
### When This Matters Most
The distinction is most critical for:
- **Boundary properties:** Properties at the edge of their suburb
- **Properties near suburb anomalies:** Where the nearest influence is across a boundary
- **Corner lots:** Where you might be affected by multiple suburb dynamics
- **Properties in small suburbs:** Where the "suburb" doesn't capture relevant nearby influences
Even for mid-suburb properties, the radius-based analysis catches things that suburb-bounded analysis might miss—like a development application just across the street in a neighbouring suburb.
---
## The Owner/Renter Map: Understanding Your Neighbours
### What the Map Shows
The owner/renter map displays the composition of properties in the immediate radius:
- **Green dots:** Owner-occupied properties
- **Yellow dots:** Rental properties
This creates a visual picture of the neighbourhood mix around your target property.
### Reading the Pattern
**Predominantly green (owner-occupiers):**
- Generally associated with better property maintenance
- Historically correlates with stronger capital growth
- Suggests residents are invested in the neighbourhood (literally)
- Typically more stable community
**Predominantly yellow (rentals):**
- Higher rental concentration
- Might indicate lower historical growth (though not always)
- Could signal opportunity if the area is gentrifying
- Consider whether the character matches your target tenant/buyer
**Mixed pattern:**
- Common in most suburbs
- The specific ratio matters less than clustering
- Look for your property's immediate surroundings, not just the general area
### Strategic Insight: The Ideal Purchase
Experienced investors often look for a specific pattern: a yellow dot (rental property) surrounded by green dots (owner-occupiers).
Why? If you buy a rental property in an owner-occupier area:
- You generate rental income now
- You benefit from the capital growth characteristics of owner-occupier areas
- When you sell, owner-occupiers will pay a premium—they're buying a home, not an investment
This is different from buying in a heavily rented area (where growth might be constrained) or buying an owner-occupied property (where rental yield might be lower).
### Warning Signs to Watch
**Clusters of yellow dots:** If you see a concentrated area of rentals, investigate. It might be:
- A large rental complex or apartment building
- Student accommodation near a university
- Transitional housing or emergency accommodation
- An area that's tipped into investor-dominated (which can suppress growth)
**Isolated yellow in premium green:** A single rental among owner-occupiers might be opportunity. But if it's been rental for decades while neighbours all owner-occupy, ask why—there might be something about the specific property.
---
## Micro Valuation: What Is This Property Actually Worth?
### How the Micro Valuation Works
The Micro Valuation provides an automated estimate of the property's value based on:
- Recent sales in the immediate area
- Property characteristics (land size, bedrooms, bathrooms, etc.)
- Block-level median prices
- Comparable property adjustments
This isn't a bank valuation or a formal appraisal. It's a data-driven estimate designed to give you a reference point.
### Coverage and Accuracy
**Coverage:** Approximately 87% of properties have Micro Valuations available. Properties in very thin markets (few sales) or unusual properties (heritage, rural, etc.) might not have valuations.
**Accuracy:** In homogeneous areas—where properties are relatively similar—the error rate is approximately 6%. In areas with highly varied properties (different block sizes, conditions, styles), the error rate is higher.
The report shows you a confidence indicator so you know how much weight to place on the valuation.
### The Three-Number Comparison
To use the Micro Valuation effectively, compare three figures:
1. **Listing price:** What the seller is asking
2. **Micro Valuation:** What the algorithm estimates
3. **Street median:** What properties typically sell for on this specific street
**Scenario A: Listing price significantly above both valuation and street median**
- The seller may be optimistic
- Or there's something special about this property (renovation, view, etc.)
- You should understand why before offering anywhere near asking price
**Scenario B: Listing price below both valuation and street median**
- Potential opportunity
- But ask why—motivated seller? Hidden problem? Priced to sell quickly?
- Worth investigating, but with healthy scepticism
**Scenario C: Listing price roughly aligned with valuation and street median**
- Market pricing is probably fair
- Negotiation room likely limited
- Decision comes down to whether the property meets your needs at market value
### What the Valuation Can't Tell You
The Micro Valuation is based on data about the property and its location. It can't assess:
- Internal condition (renovated vs. original)
- Quality of finishes
- Specific views or light
- Recent improvements or damage
- Intangible factors that affect buyer appeal
Use the valuation as one input, not the only input. Combine with inspection observations and comparable sales analysis.
---
## Automated CMA: Building Your Negotiation Ammunition
### Why Relevance Beats Recency
Most comparable sales tools sort by date. They show you what sold last week, last month, last quarter—regardless of whether those properties are actually comparable to yours.
The problem: a property that sold last week but is 100 sqm smaller on land, has one fewer bedroom, and is on a busy road isn't really comparable. It just happened to sell recently.
The Automated CMA takes a different approach: it prioritises relevance over recency.
### How Relevance Is Calculated
The CMA weights multiple factors:
- **Land size similarity:** A property with similar land size is more comparable than one with very different land size
- **Bedroom/bathroom count:** Same configuration is more relevant
- **Distance from subject property:** Closer properties are in more similar micro-markets
- **Property type and style:** Houses compared to houses, units to units
- **Recency:** Recent sales are still preferred, but not at the expense of relevance
A property that sold two years ago but matches your target on land size, bedrooms, and street type might be more informative than one that sold last week but differs substantially.
### Reading the CMA Output
For each comparable, you see:
- **Sale price and date:** What it sold for and when
- **Property comparison:** How it differs from your target (bigger land, more bedrooms, etc.)
- **Distance:** How far from your subject property
- **Relevance score:** How comparable the algorithm judges it to be
Focus on the most relevant comparables, even if they're not the most recent. If five highly-relevant properties sold between $750,000-$800,000 over the past two years, that's your likely range—regardless of whether an outlier sold for $900,000 last month.
### Using Comparables in Negotiations
This is where the CMA becomes powerful tactically.
Instead of vague assertions ("I think it's worth less"), you can point to specific sales:
- "The property at 42 Smith Street sold for $785,000 in March. Same land size, same bedroom count, 200 metres away. Why should I pay $850,000 for this one?"
- "These four comparables all sold between $750,000 and $790,000. The listing price of $830,000 seems optimistic."
Real estate agents use comparable sales to justify prices. With the CMA, you have the same data to challenge their justifications.
---
## Easements: Understanding Encumbrances on the Land
### What Easements Are
An easement is a legal right for someone else to use part of your land for a specific purpose. Common types include:
**Utility easements:** Power lines, water mains, sewer pipes, gas lines running through or under the property. The utility company has the right to access these for maintenance.
**Right of way easements:** Legal access for neighbours or others to cross your property. Often found where a rear property has no direct street access.
**Drainage easements:** Stormwater drainage routes that must remain clear. Often found in low-lying areas or along natural drainage lines.
**Access easements:** Similar to right of way, allowing access for specific purposes (e.g., shared driveway).
### Why Easements Matter for Investment
Easements affect what you can build and how you can use your land:
- **Building restrictions:** You typically can't build permanent structures over utility easements. That granny flat you planned might be impossible if the easement crosses the backyard.
- **Subdivision complications:** Easements that run through a property can complicate or prevent subdivision.
- **Development limitations:** Even if you're not developing now, easements affect future flexibility and can impact resale to developers.
- **Access obligations:** Right of way easements mean others have legal access through your property—you can't block them.
### Reading the Easement Overlay
The Property Report shows easements registered on the title, typically displayed as lines or zones on the property boundary plan.
Key things to note:
- **Location:** Where on the property does the easement run?
- **Width:** How wide is the affected area?
- **Purpose:** What is the easement for?
- **Beneficiary:** Who has rights under the easement?
### Making Decisions About Easements
Most properties have some easements—they're not automatic deal-breakers. The question is whether the easement affects your plans:
**Planning to build a granny flat?** Check if the easement crosses the area you'd build.
**Planning to subdivide?** Easements might complicate or prevent subdivision.
**Planning to renovate/extend?** Check if the easement affects your extension footprint.
**Planning to hold as-is?** Probably not an immediate issue, but consider resale implications.
**Professional advice:** For any property you're serious about, have your conveyancer explain the easement implications. The Property Report flags them—your legal advisor explains what they mean for you specifically.
---
## Development Applications: What's Coming to the Neighbourhood
### Why DAs Matter
Development Applications show you what's being planned or built around your property. This is future-looking information that can significantly affect your investment.
What's approved today will exist tomorrow. A DA for a 50-unit apartment building next door will change your street's character, parking, traffic, and potentially your property's value.
### Types of DAs to Watch
**Subdivision DAs:** Multiple subdivision applications in an area suggest:
- The area is transitioning
- Developers see value in splitting lots
- Density is increasing
- Character may be changing
This isn't inherently good or bad—it depends on your strategy and what you're buying.
**Multi-dwelling DAs:** Townhouse or unit developments indicate:
- Increased density coming
- Potential increased traffic and parking pressure
- Changed neighbourhood character
- Possibly positive (more activity) or negative (less space) depending on perspective
**Renovation/extension DAs:** Multiple renovation applications suggest:
- Owner-occupiers investing in their properties
- Area is improving
- People want to stay and upgrade rather than leave
- Generally positive for neighbourhood trajectory
**Commercial/industrial DAs:** New businesses or industrial uses might:
- Increase traffic and noise
- Change the character of the area
- Provide convenience (shops, cafes) or nuisance (loading zones, late-night noise)
### Evaluating Nearby DAs
When you see a significant DA near your property:
1. **Distance:** How close is it? Adjacent vs. 500 metres away makes a difference.
2. **Scale:** A single townhouse is different from a 200-unit complex.
3. **Status:** Pending, approved, or rejected? Pending might not proceed; approved definitely will.
4. **Timeline:** When was it lodged/approved? Very old approvals might have lapsed.
For anything concerning, look up the full DA on the council website. The Property Report flags the existence—you do the deeper investigation on anything that raises questions.
### Warning Signs
**Large multi-unit developments immediately adjacent:**
- Will affect your light, privacy, and views
- Will increase parking pressure on your street
- Will change the immediate character
- Might be fine, might be problematic—needs investigation
**Industrial or commercial DAs creeping in:**
- Suggests zoning or area character might be shifting
- Could bring noise, traffic, operating hours concerns
- Might indicate area is not purely residential long-term
---
## Public Housing Proximity: Making an Informed Decision
### Why This Section Exists
Public housing proximity is one of the most asked-about factors in property investment. It's also one of the most emotionally charged—people have strong opinions.
The Property Report presents the data objectively so you can make an informed decision based on your own risk tolerance and investment thesis.
### What the Data Shows
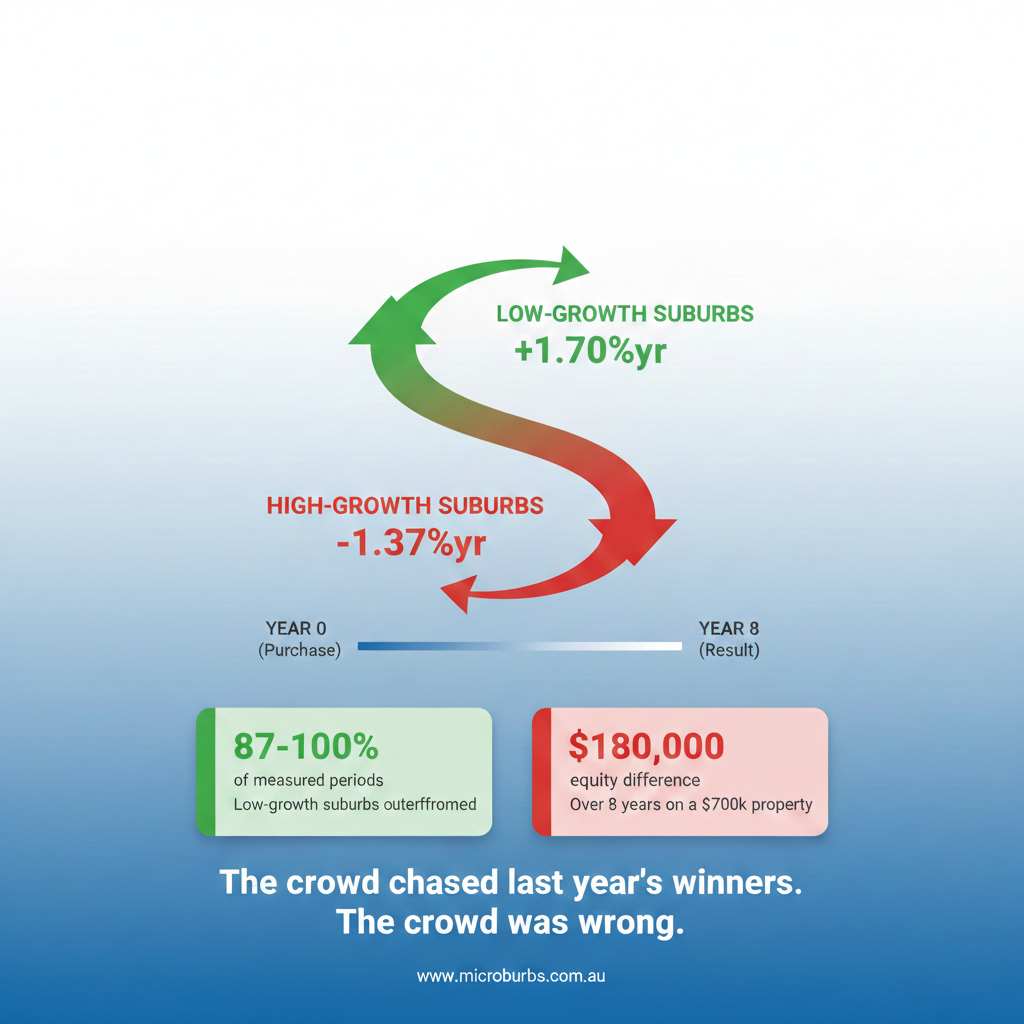
Historical data consistently demonstrates that properties near concentrations of public housing typically experience lower capital growth compared to equivalent properties further away. This is measurable, across many markets, over long time periods.
This doesn't mean public housing is "bad"—it provides essential social services. It means the property market prices in proximity as a factor that affects values.
### The Nuance of Proximity
"Near" is not binary—it's a spectrum:
**Immediately adjacent (next door, across the street):**
- Most significant impact on value and growth
- Visible and obvious to any buyer
- Will affect your tenant/buyer pool
- Priced into the property accordingly
**Same block or very close (50-100m):**
- Noticeable impact, though less than immediately adjacent
- May or may not be obvious depending on screening
- Still affects some buyer segments
**Same general area (200-300m):**
- Minimal measurable impact in most studies
- Not obvious unless someone specifically looks
- Broader area characteristics matter more than this specific factor
**What the report shows:** The Property Report indicates if public housing exists within a specified radius and how far away it is. This lets you assess which category you're dealing with.
### Concentration Matters Too
One public housing property among 50 private properties is different from a large public housing estate:
**Scattered individual units:**
- Minimal impact on area character
- Often not even noticeable
- Effect on growth typically small
**Small clusters:**
- Some impact on immediate streets
- Effect diminishes with distance
- May affect specific buyers but not general demand
**Large estates:**
- Significant impact on immediate area
- Can define the character of surrounding streets
- Material effect on growth rates and buyer pools
### Making Your Decision
Some investors avoid any public housing exposure—they want to eliminate this variable entirely. Their filtered search excludes it, and they never consider affected properties.
Other investors view public housing proximity as a discount opportunity:
- Buy cheaper now
- Bet on area improvement over time
- Hope for public housing redevelopment (which does happen)
- Accept lower growth for lower entry price
Neither approach is inherently right or wrong. What's wrong is not knowing—discovering public housing exists only after you've bought, when your growth disappoints.
The Property Report ensures you make this decision consciously, with full information, according to your own investment thesis.
---
## Putting It All Together: The Property Report Workflow
### Systematic Analysis
For each property from your Step 3 shortlist, work through the Property Report systematically:
**1. Boundary Check**
- Is this property near a suburb boundary?
- If yes, pay extra attention to what's across that boundary
- The radius-based analysis matters more here than for mid-suburb properties
**2. Owner/Renter Mix**
- What's the pattern around this specific property?
- Green-dominant, yellow-dominant, or mixed?
- Any concerning clusters nearby?
- Does the pattern match your investment thesis?
**3. Valuation Context**
- How does listing price compare to Micro Valuation?
- How does it compare to street median?
- Is the valuation confidence high or low?
- What does this suggest about pricing?
**4. Comparable Sales Analysis**
- What have the most relevant comparables sold for?
- What's the reasonable range for this property?
- Do you have ammunition for negotiation?
- Any outliers that need explanation?
**5. Easement Review**
- What easements are registered?
- Do they affect your plans for the property?
- Any that require legal clarification?
**6. Development Application Scan**
- What's being developed nearby?
- Any immediate-neighbour DAs that concern you?
- Any patterns (many subdivisions, large developments) to note?
**7. Public Housing Assessment**
- Is there public housing within the radius?
- If yes, how close and how concentrated?
- Does this affect your decision, given your strategy?
### Go/No-Go Decision
After working through these elements, you should be able to answer:
**Proceed to inspection/offer:**
- No concerning issues in any category
- Valuation supports the asking price (or you have negotiation strategy)
- Micro-environment matches what you want
- Ready to invest inspection time and potentially make an offer
**Pass on this property:**
- Identified issues that don't match your strategy
- Valuation suggests significant overprice without negotiation room
- Micro-environment doesn't align with your thesis
- Move on to next property in your shortlist
**Investigate further:**
- Some issues need more information before deciding
- Need legal advice on easements
- Need to research specific DA in detail
- Need to understand a pricing anomaly
### The Efficiency of Systematic Analysis
By working through each property systematically, you:
- Don't miss important factors (easements you forgot to check, DAs you didn't notice)
- Make decisions consistently (same criteria applied to each property)
- Build a record (if you review 20 properties, you can compare your notes)
- Avoid emotional decisions (data-driven process resists "I just loved it" bias)
---
## What You Should Have After Step 4
### For Properties You're Pursuing
For each property you decide to pursue, you should have:
**Valuation confidence:** Understanding of what the property is worth and how listing price compares
**Comparable sales documentation:** Specific sales you can reference in negotiations
**Risk awareness:** Clear understanding of easements, nearby development, public housing proximity, and any other factors
**Micro-environment understanding:** Knowledge of who your neighbours are (owners vs. renters) and the character of the immediate area
**Decision rationale:** Documented reasoning for why this property fits your strategy
### For Properties You're Passing On
You should know why:
- Valuation concern (overpriced without negotiation room)
- Easement issue (affects your plans)
- Development concern (problematic DA next door)
- Micro-environment mismatch (too rental-heavy, too close to public housing, etc.)
- Other factor identified through analysis
This documentation helps you:
- Avoid second-guessing decisions later
- Learn patterns (if you pass on many properties for similar reasons, adjust your filters)
- Communicate with partners, advisors, or accountants who might ask why you didn't buy
### For Your Next Steps
Properties you're pursuing move to:
- Physical inspection
- Building and pest inspection (if moving forward)
- Legal review (contract, title, specific easement questions)
- Finance pre-approval or final approval
- Offer preparation and negotiation
The Property Report doesn't replace these steps—it ensures you only spend time and money on properties that warrant it.
---
## The Complete 4-Step Journey
Looking back at the full workflow:
**Step 1: Suburb Finder**
- Started with all of Australia
- Applied criteria and metrics
- Ended with 5-10 promising suburbs
**Step 2: Suburb Reports**
- Analysed pocket-level variation
- Applied risk overlays
- Ended with specific pockets and streets in 2-4 suburbs
**Step 3: Property Finder**
- Searched current listings
- Applied filters and exclusions
- Ended with 10-50 qualified properties
**Step 4: Property Reports**
- Conducted due diligence on individual properties
- Assessed valuation, comparables, easements, DAs, proximity factors
- Ended with go/no-go decisions on each property
### The Transformation
The traditional approach: **months of random research, high wastage, emotional decisions, surprises after purchase.**
The 4-step approach: **systematic narrowing, data-driven decisions, no surprises, confident offers.**
You haven't just found properties—you've qualified them at every level. The suburb is sound. The pocket is sound. The property passed your criteria. The due diligence checks out.
You're not hoping you got lucky. You're confident you've done the work.
---
## Final Thoughts: Data-Driven, Not Data-Determined
### The Role of Data
Throughout this 4-step process, data has guided your decisions:
- Growth Forecasts identified promising suburbs
- Pocket analysis revealed micro-market variation
- Filters screened properties against your criteria
- Property Reports surfaced specific issues and opportunities
This data-driven approach is powerful. It removes guesswork, prevents emotional decisions, and catches problems before they become expensive mistakes.
### What Data Can't Do
But data doesn't make your decisions for you.
- **Investment thesis is yours:** Data shows you what is. Your strategy determines what matters.
- **Risk tolerance is yours:** Some investors accept flood risk for lower prices. Others don't. Data shows the risk exists; you decide if you accept it.
- **Personal factors are yours:** Proximity to family, familiarity with an area, gut feel about a street—these matter and data can't capture them.
- **Market judgment is yours:** Data shows historical patterns. Whether those patterns continue is a judgment call.
### The Ideal Combination
The best property investors combine data discipline with personal judgment:
- Use data to screen, filter, and narrow systematically
- Use judgment to make final decisions among qualified options
- Never rely entirely on either
The 4-step workflow gives you the data discipline. Your experience, strategy, and judgment provide the rest.
---
## What Comes Next
With Property Reports complete, you're ready to:
1. **Inspect properties** you've decided to pursue
2. **Make offers** on properties that pass inspection
3. **Negotiate** using your comparable sales analysis
4. **Complete legal and financial due diligence** for properties under contract
5. **Purchase** with confidence
The research is done. The due diligence is complete. You know what you're buying and why.
Now you execute.
---
*This concludes the 4-part series on the data-driven property research workflow.*
---
## Appendix: Beyond the 4 Steps
### Data Explorer (Advanced Users)
For investors who want to go deeper, Data Explorer provides access to 5,000+ individual metrics and custom heat maps. Useful for testing specific investment theses with actual data.
**Who it's for:** Advanced users, data-driven investors, researchers who have mastered the basics and want to analyse specific metrics.
**Recommendation:** Complete the 4-step workflow first. Data Explorer is powerful but can overwhelm users who haven't built the foundational understanding.
### Professional Features (Buyer's Agents)
For buyer's agents and property professionals:
- **White-labeled reports:** Your logo, your branding, your URLs
- **Shareable links:** Clients don't need accounts—just click and view
- **Client workflow:** Use Suburb Reports for education, Property Reports for due diligence
The 4-step workflow becomes your client delivery process, with professional presentation at each stage.