Throughout Microburbs products, you'll see us gently nudging you towards suburbs and properties that have underperformed in the past 3-10 years.
This seems counterintuitive to many—surely suburbs that have grown a lot have good fundamentals and will continue on their trajectory?
After analyzing 27 years of Australian property transaction data—579,541 to 969,562 transactions depending on the analysis—we found a remarkably consistent pattern:
Suburbs with below-average historical growth consistently outperformed suburbs with above-average historical growth over the following years.
And it wasn't just consistent—it appeared in 87–100% of the time periods we measured, depending on how far forward we looked.
The Core Finding
We measured suburbs' price growth over different historical periods (3, 5, or 10 years), then tracked what happened to those suburbs over the next 2, 4, or 8 years.
The pattern:
- Suburbs that had grown slowly in the past went on to outperform
- Suburbs that had grown rapidly in the past went on to underperform
How Consistent Was This?
The Precise Thresholds: 3-Year Growth → 8-Year Forward
What These Numbers Mean in Practice
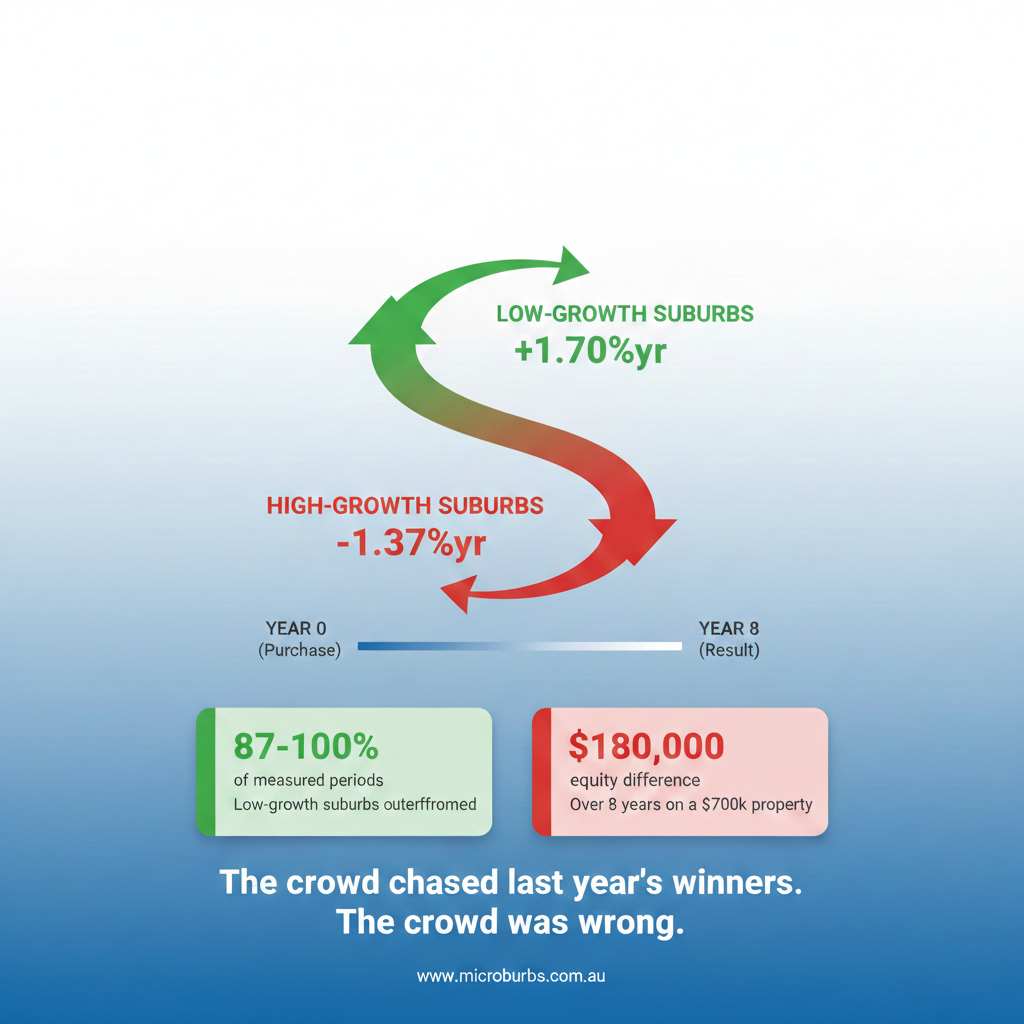
A suburb that has grown less than 38% over 3 years (roughly 11.3% per annum or below) is in the green zone. Historically, these "underperformers" went on to beat the national average by +1.70% per year over the following 8 years.
A suburb that has grown more than 53% over 3 years (roughly 15.3% per annum or more) is in the red zone. Despite their impressive recent track record, these suburbs subsequently underperformed by −1.37% per year over the next 8 years.
The swing from green to red is 3.07 percentage points per year. Over 8 years, on a $700,000 property, that compounds to roughly $180,000 in additional equity for the investor who chose the low-growth suburb over the high-growth one.
The yellow zone (38%–53% growth) is already in negative territory at −0.99%/yr. This is an important nuance: you don't need to buy the hottest suburb to get burned. Even "moderate-high" growth suburbs tend to give back their gains.
What Does "Outperform" Mean?
When the pattern appeared, effect sizes were substantial:
- Low-growth suburbs: +1.7% to +2.9% annually
- High-growth suburbs: –1.0% to –2.5% annually
Example - 10-year historical → 8-year future:
- Low-growth suburbs: +2.0% annual outperformance
- High-growth suburbs: –2.1% annual underperformance
Over 8 years, this compounds to a 32–33% difference in total returns.
The Measurement Period
The data spans 1998–2025, covering:
- All 15 GCCSA regions
- Rest-of-state areas
- 115–187 distinct measurement periods depending on horizon
It persisted through every major cycle:
- GFC (2008–2009)
- Mining boom/bust (2010–2014)
- East-coast boom (2015–2017)
- COVID disruption (2020–2021)
- Interest rate rises (2022–2025)
The Pattern Is Remarkably Consistent Over Time
The standout result isn't magnitude—it's reliability.
Across hundreds of measurements, covering three decades and every market regime, the pattern kept appearing.
In some configurations, it appeared in literally every single period measured.
For reference: suburbs that grew less than 44.1% over a 10-year period (poor performance in a market used to 6-8% annual growth) subsequently outperformed the market every single month from 2016 to 2026, averaging +1.5% outperformance.
For the worst performers (who were previously the best), their subsequent 8-year growth was 2% less than the national average.
Short vs Long Time Frames
Important Caveats
This is NOT:
- A prediction for individual properties
- A guarantee that high-growth suburbs will fall
- A forecast for purchases made today
This IS:
- A suburb-level historical pattern
- A relative performance measure
- Evidence of mean reversion in Australian property markets
The percentages reflect how often the pattern appeared historically—not the probability it will occur for your next purchase.
Data Quality: Why This Matters
Compositional bias is a major trap in property analysis.
We filtered out suburbs where:
- New builds exceeded thresholds
- Renovations surged (tracked via building permits)
- Median characteristics changed substantially
What remained reflected genuine price movements, not quality changes.
The Thresholds
3-Year Median Price Growth → 8-Year Forward Performance
Broader Historical Pattern
The Bottom Line
Across nearly three decades and hundreds of thousands of transactions:
Suburbs with below-average historical growth (3–10 years) outperformed suburbs with above-average historical growth over the following 2–8 years in 87–100% of measured periods.
The precise threshold: suburbs with 3-year growth below 38% outperformed by +1.70%/yr. Suburbs above 53% underperformed by −1.37%/yr. The pattern persisted:
- Through every market cycle
- Every rate regime
- Every macro shock
It is a suburb-level trend, not a property-level predictor. But the temporal consistency is exceptional.
What This Means for You
The research doesn't prescribe action. It reports one of the strongest historical empirical regularities in Australian property.
Historically: The crowd chased last year's winners. The crowd was wrong in 87–100% of measurable periods.
Whether you act on that is your choice.
About This Research
Based on 27 years of Australian property transaction data (1998–2025), covering 579k–969k sales depending on specification. Suburb boundaries follow ABS GCCSA definitions. Extensive filtering removed suburbs affected by compositional bias.
Disclaimer
This article presents research findings and is not investment advice. Past performance does not guarantee future results. Property carries risks including capital loss, illiquidity, and high transaction costs. The pattern described may not continue in the future. Seek professional advice.