From Search to Success - Your 4 Step Process
Fragmented research plagues property hunts, forcing manual digs through portals and council records for scattered insights. Microburbs consolidates this into a streamlined pipeline, delivering weekly refreshed data and back-tested forecasts for solid decisions. No more guesswork on growth or risks. One agent noted it slashes due diligence from hours to minutes, freeing time for client focus. This guide walks you through the steps, from suburb shortlisting to final checks, showing how tools like Suburb Finder and Property Reports turn data into deals.
👉 Start Your Free Trial
Step One: Shortlisting with Suburb Finder
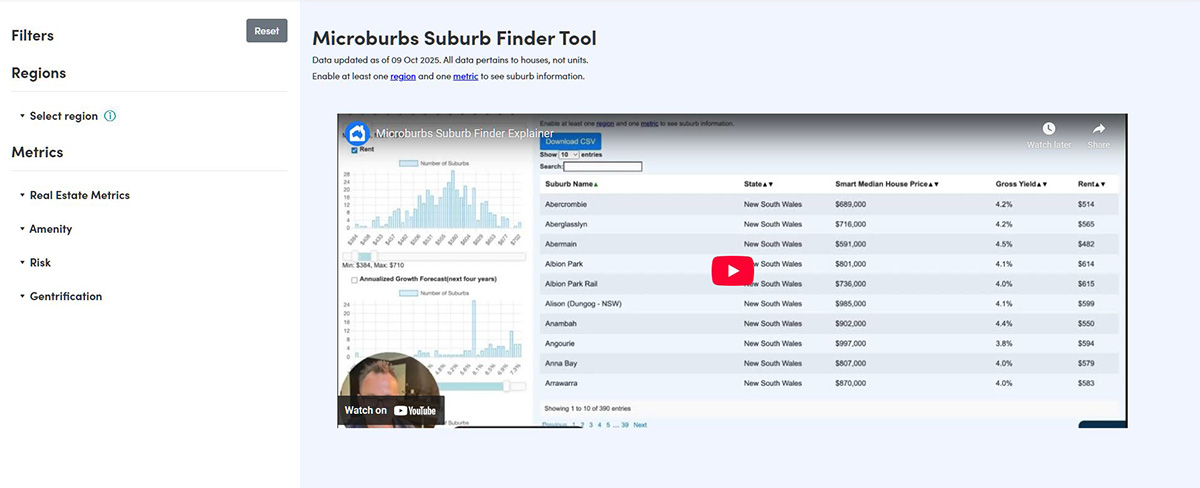
Begin broad, scanning thousands of suburbs nationwide. Apply filters across real estate metrics such as four year growth forecasts outperforming the seven percent national average, yields above four percent, and vacancy rates. Layer in amenities via lifestyle and hip scores, risks including public housing percentages and safety ratings, plus gentrification signals like affluence and family scores. The interface presents interactive panels for these, yielding a results table ranked by your criteria. Membership unlocks advanced access, narrowing national views to targeted lists swiftly, spotting early outperformers before crowds arrive.
Step Two: Forecasting and Analysis via Suburb Reports
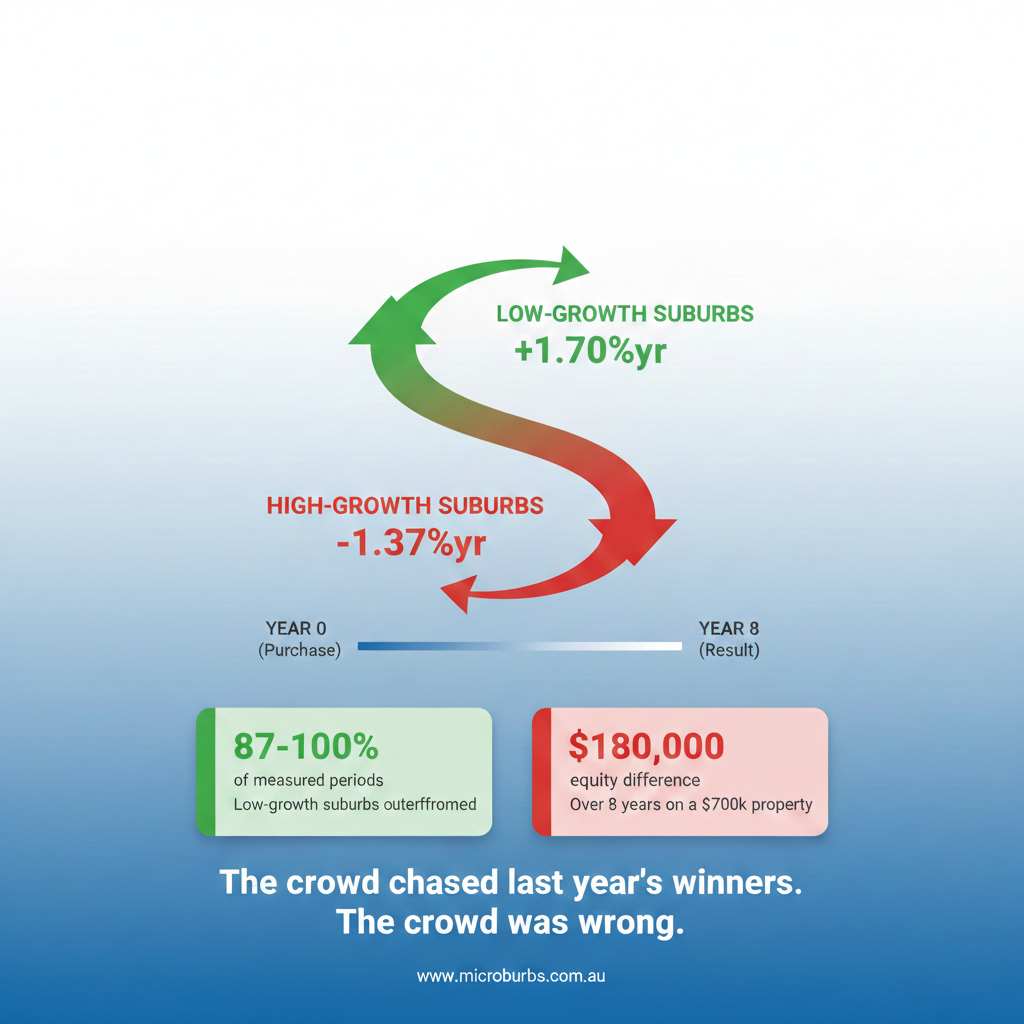
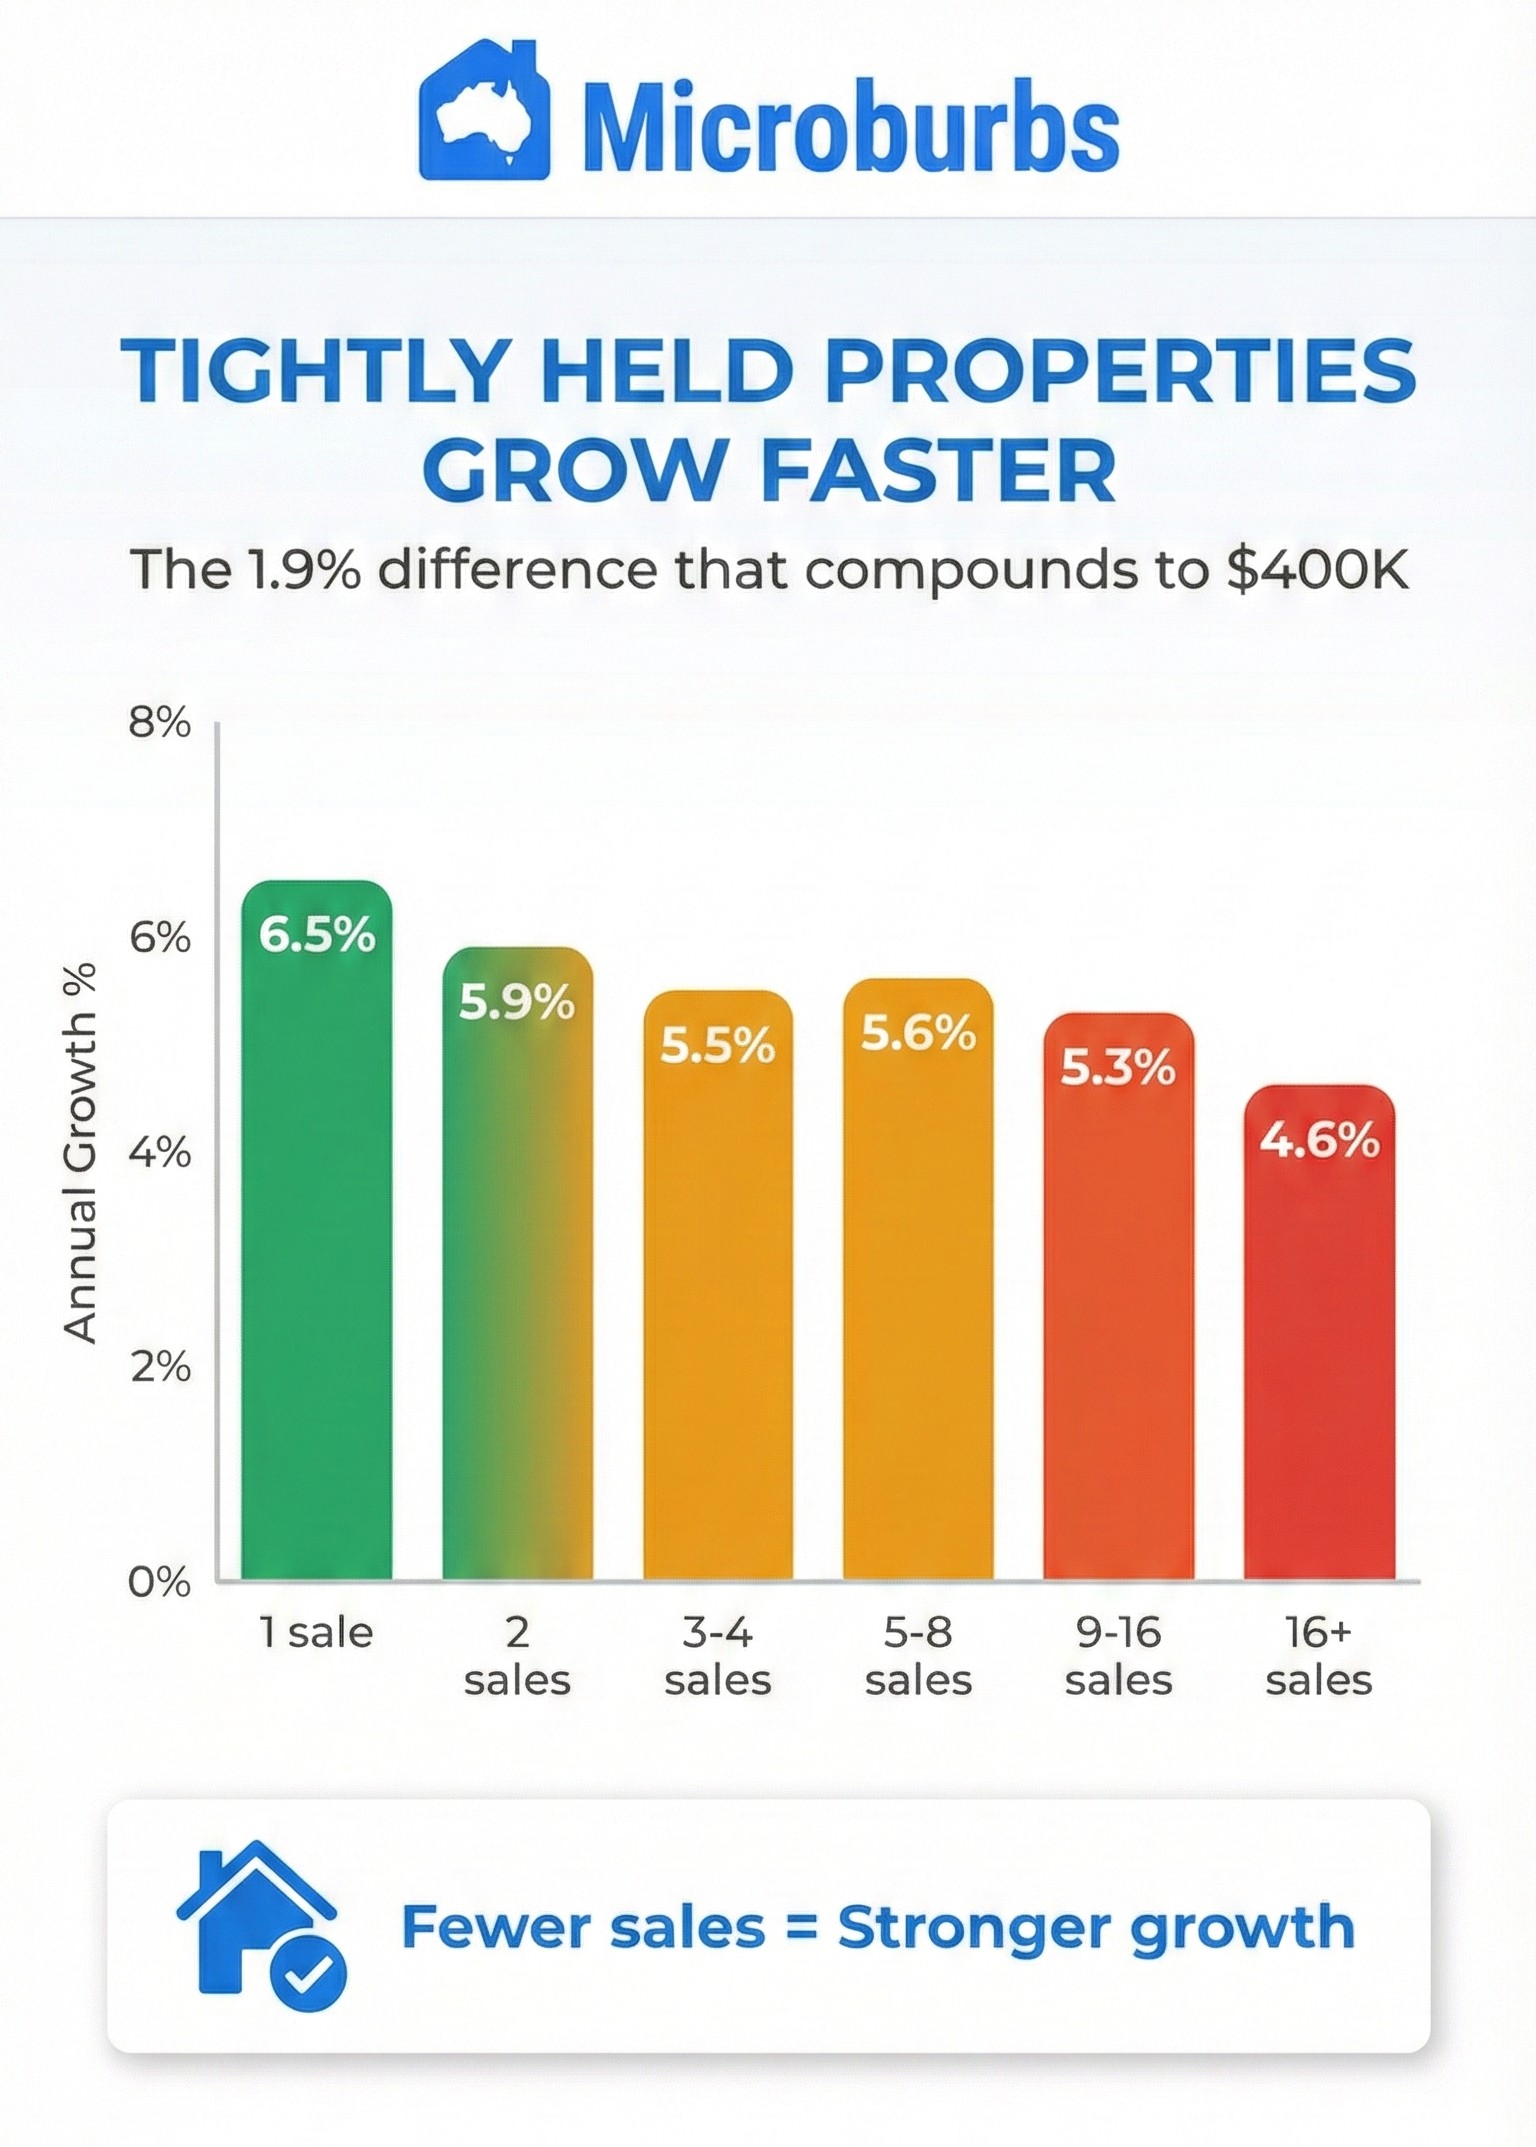
Validate shortlists with detailed reports projecting four year price growth, drawing on back-tested models since two thousand five. Examine pocket medians for stable values, street level renter ratios, turn overrates, and risks like bushfire zones or flood areas. These insights reveal hidden drags, such as public housing impacts on capital growth, and guide avoidance of volatile pockets. Users leverage projections to persuade clients, as one shared how forecasts justified interstate investments. Sample pages feature interactable maps and charts, updating weekly to track shifts in demographics or development approvals.
Step Three: Ranking Listings with Property Finder

Shift to active properties using the AI Shortlisting tool, which scans over one hundred twenty thousand listings beyond major portals. Input criteria like suburbs, budget, and demographics; it ranks by growth potential, delivering objective pros and cons while flagging risks such as noise or public housing proximity. Bushfire adjacent properties drop lower automatically. The ranked list includes overlays for quick scans, covering webwide sources for broader discovery. This objective sift uncovers matches others miss, prioritising high yield options aligned to your strategy.
👉 Start Your Free Trial
Step Four: Due Diligence in Property Reports
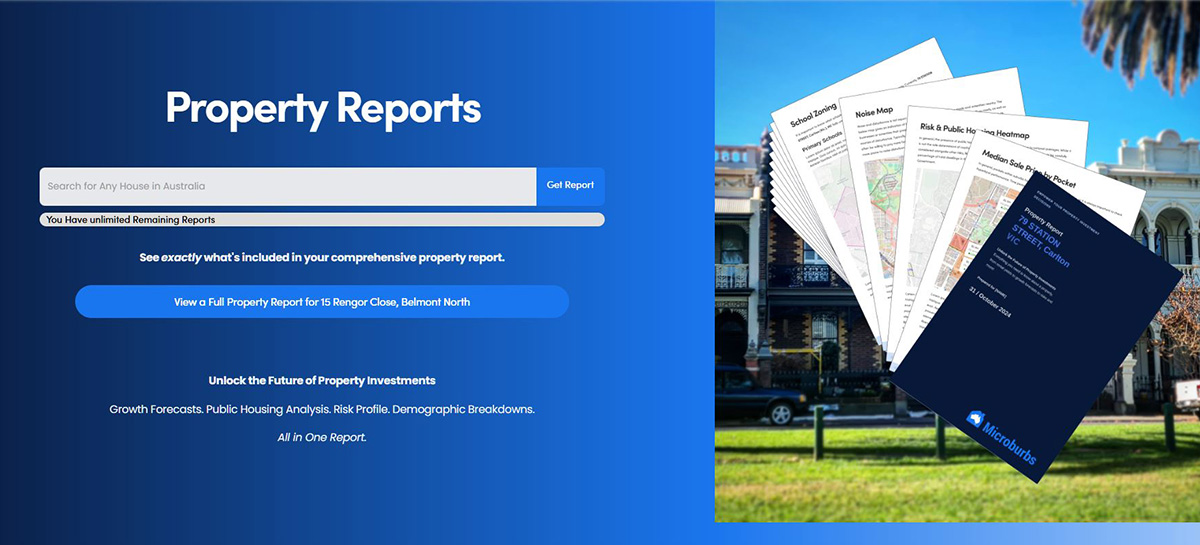
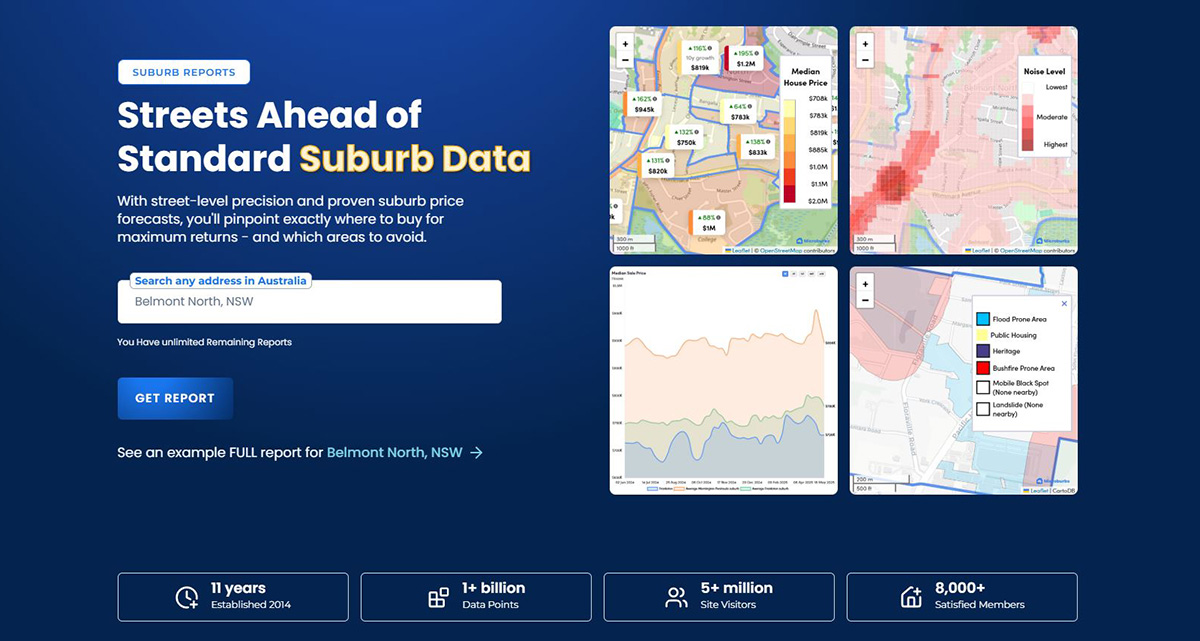
Finalise with property specific reports offering automated valuations via machine learning, comparable market analysis for recent sales context, and neighbour demographics like owner occupier ratios. Interactive risk maps highlight bushfire, flood, and public housing proximities, alongside street level trends and subdivision potentials. These confirm value before purchase, spotting easements or defects early. A sample for a Belmont North address shows comps overlaid on maps and precise valuations. Users report this step cements decisions, turning data into assured buys without surprises.
Real World Time Savings and Outcomes
Microburbs’ pipeline transforms property investment by slashing time and boosting confidence, as evidenced by aggregated insights from buyer's agents and investors. What once took hours—manually scouring portals, cross-referencing council records, and piecing together fragmented data—now takes minutes, thanks to a seamless, data-driven workflow. This efficiency empowers agents to focus on client relationships and strategy, while investors make faster, informed decisions, even for sight-unseen purchases across state lines. The platform’s granular insights and back-tested models consistently deliver outcomes that outperform market averages, addressing common fears like missing risks or overpaying.
Key benefits include:
- Drastic Time Reduction: Due diligence drops from hours to minutes by consolidating suburb scans, risk assessments, and valuations into one platform, freeing agents to handle more clients or refine strategies.
- Sight-Unseen Confidence: Objective rankings and risk flags (e.g., flood zones, public housing proximity) enable secure interstate buys, as one agent noted: "It ranks properties and flags risks—perfect for sight-unseen deals."
- Market Outperformance: Four-year growth forecasts, back-tested since 2005 with 85% accuracy, help users target suburbs and properties poised to exceed market growth by 7-8%, maximising returns.
- Reduced Analysis Paralysis: Clear, data-driven insights replace guesswork, with users reporting streamlined decisions and less overwhelm when shortlisting high-yield or growth-focused properties.
- Enhanced Client Trust: Automated valuations, comparable sales, and visual risk maps build compelling, transparent cases, as one investor shared: "Clients trust recommendations backed by this level of detail."
- Error Mitigation: Flagging hidden risks like zoning changes, easements, or oversupply ensures agents avoid costly oversights, protecting reputation and client investments.
These outcomes stem from Microburbs’ weekly updated data and comprehensive tools, empowering users to act swiftly and decisively in dynamic markets.
Conclusion
This pipeline equips investors and agents with efficiency, from broad scans to pinpoint diligence, backed by fresh, granular data. Weekly updates keep you ahead of shifts, while back-tested tools minimise errors. Test the workflow yourself to see gains in speed and precision. Start your free trial at microburbs.com.au/free-trial. For ongoing edges, subscribe to weekly insights, ensuring recommendations stand firm amid market flux.
👉 Start Your Free Trial