Step 1: Finding Your Suburbs
How to Answer "What Suburbs Should We Look At?" Using Data Instead of Guesswork
This is Part 1 of a 4-part series on the data-driven property research workflow.-----The Starting Point Problem
Every property investor faces the same paralysing question at the beginning of their journey: where do I even start looking?
Australia has over 15,000 suburbs. Each state has hundreds of options. Even narrowing to a single city like Sydney or Melbourne still leaves you with thousands of possibilities. The sheer volume of choice creates decision paralysis before you've even begun.
So what do most investors do? They fall back on what they know:
- The suburb they grew up in (familiar, but is it actually a good investment?)
- The suburb a friend recommended (anecdotal, based on one person's experience)
- The suburb they read about in the news (often already peaked by the time it makes headlines)
- The suburb their mortgage broker mentioned (usually based on where they've seen activity, not where activity is coming)
None of these approaches are data-driven. They're all variations of "I heard this suburb is good" without any systematic analysis of whether it actually fits your investment criteria.
The result? Investors spend months—sometimes years—researching suburbs that were never going to work for their situation. They fall in love with an area, find a property, then discover the fundamentals don't support their investment thesis. Or worse, they buy anyway and learn the hard way.-----Why Traditional Suburb Research Fails The Backwards Approach
Think about how property portals work. You go to Domain or REA, you type in a suburb name, and you see properties for sale. The entire model assumes you already know which suburb you want.
But that's the biggest decision you'll make—and you're making it with the least information.
The portal approach puts the cart before the horse. You're choosing your suburb based on familiarity or hearsay, then applying all your analytical energy to choosing between houses within that suburb. You're optimising the small decision while guessing on the big one. The "Hot Suburb" Trap
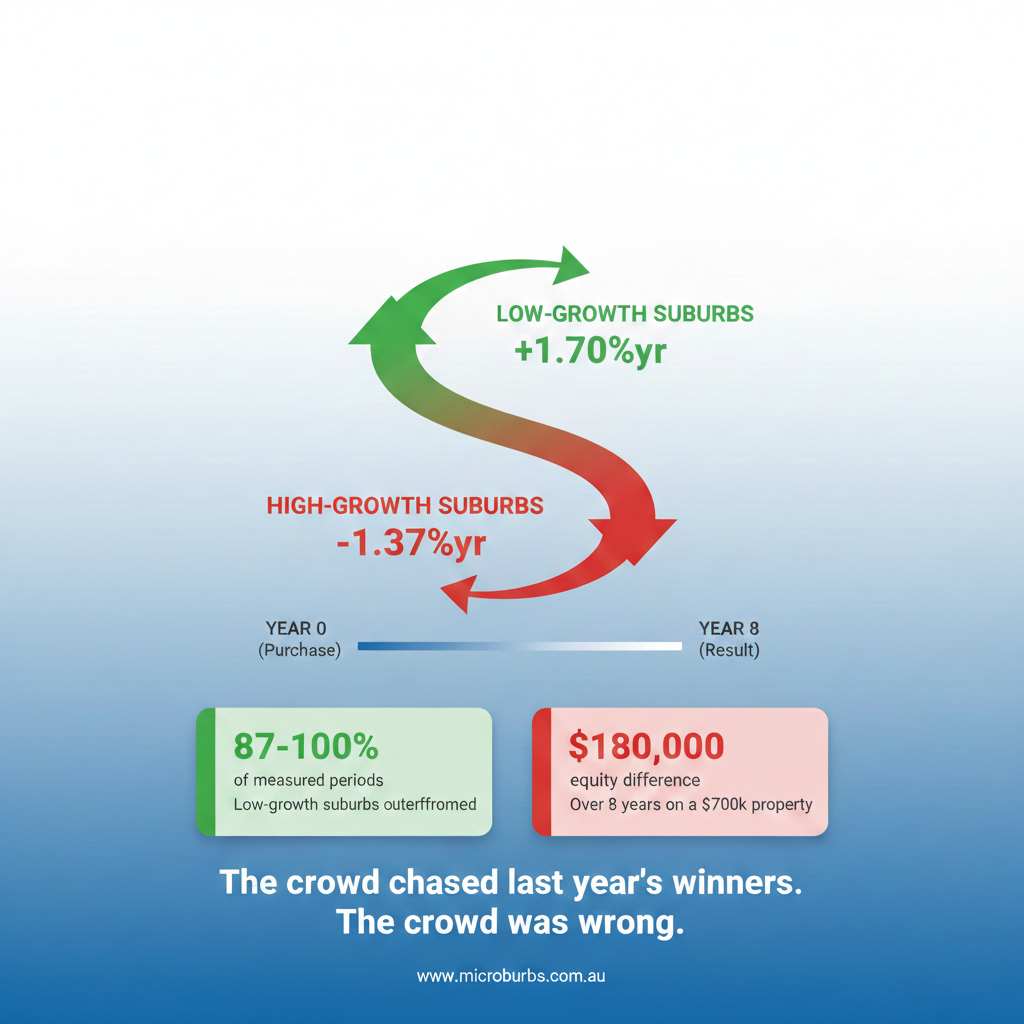
Property media loves stories about suburbs that have grown 30% in a year. These articles generate clicks because they trigger FOMO—fear of missing out.
But by the time a suburb makes the news for exceptional growth, the growth has already happened. You're reading about past performance, not future opportunity. Buying into a suburb because it just grew 30% is like buying a stock because it just peaked. The easy gains are gone.
What you actually want is to identify suburbs before they appear in headlines—when the conditions for growth are present but prices haven't moved yet. The "Local Expert" Myth
Many investors believe local knowledge is the key to finding good suburbs. There's some truth to this—understanding an area's character, its schools, its transport links, its social dynamics—these things matter.
But local knowledge also creates blind spots. Someone who grew up in the eastern suburbs of Sydney might dismiss the western suburbs without ever analysing the data. Someone from Melbourne might overlook regional Victoria entirely. Local knowledge tells you about areas you already know; it tells you nothing about the 14,900 suburbs you've never visited.
The best investors combine local insight with systematic data analysis. They use data to identify where to focus, then apply their judgment and local research to validate.-----The Suburb Finder Approach: Inverting the SearchStarting With Criteria, Not Location
Suburb Finder works the opposite way to property portals. Instead of you choosing a suburb and then seeing what's available, you define your investment criteria and the system shows you which suburbs match.
This is a fundamental shift in approach. You're no longer asking "Is this suburb I've heard of any good?" You're asking "Of all suburbs in Australia, which ones fit what I'm looking for?"
The difference matters because it removes the limiting factor of your own awareness. You might discover suburbs you've never heard of that perfectly match your criteria. You might find that the suburb your friend recommended doesn't actually meet your requirements. Either way, you're making decisions based on data, not assumptions. The Core Filters
Location Parameters
You can search within a specific state, a specific region within a state, or—if you're truly open-minded—nationwide.
Most investors default to their own city. That's understandable if you plan to manage the property yourself or if you want to be able to visit easily. But if you're using a property manager anyway, the physical location matters less than the investment fundamentals.
Consider this: restricting your search to Sydney means competing with everyone else who's restricted their search to Sydney. The pool of buyers is enormous, which means prices are bid up. Expanding your search to Queensland or regional NSW might reveal opportunities with the same fundamentals but less competition.
Budget Range
Setting your budget seems straightforward, but there's a strategic consideration most investors miss.
The median price shown for a suburb is exactly that—the median. Half the properties in the suburb sell for more, and half sell for less. Within any suburb, there are pockets that are significantly cheaper than the median and pockets that are significantly more expensive.
If your actual budget is $800,000, you might set your filter to $900,000 or $950,000. Why? Because a suburb with a $900,000 median might have pockets where properties sell for $750,000-$800,000. If you filter too tightly, you miss those opportunities.
You're not looking for suburbs where the median matches your budget. You're looking for suburbs where below-median pockets match your budget. That's a subtle but important distinction.
Property Type
Houses, units, or both—this filter aligns your search with your investment strategy.
For most growth-focused investors, houses are the priority. The logic is straightforward: land appreciates while buildings depreciate. A house gives you exposure to land value, which typically drives long-term capital growth.
Units can make sense for cash flow strategies or in areas where house prices are prohibitive. But understand the trade-off: unit prices are more dependent on building quality and body corporate management, and they typically experience lower capital growth than houses in the same area.-----Understanding the Key Metrics
Once you've set your basic filters, Suburb Finder returns a list of matching suburbs. But the raw list is just the starting point. The real power is in the metrics you can apply to rank and filter further.Growth Forecast: The Predictive Metric
The Growth Forecast is the standout metric—and it's one you won't find on other platforms.
What it measures: The Growth Forecast identifies where a suburb sits in its market cycle. It analyses patterns that historically precede price growth: supply constraints, demand dynamics, demographic shifts, price momentum indicators, and dozens of other factors.
How it's calculated: The algorithm looks at current conditions in the suburb and compares them to historical patterns from suburbs that subsequently experienced above-average growth. It's not predicting specific percentage returns—it's identifying whether the conditions for growth are present.
The accuracy: Backtested over 15 years of data across all Australian suburbs, the algorithm has an 85% accuracy rate in identifying suburbs that will outperform their benchmark.
What it means: A high Growth Forecast doesn't guarantee 20% growth next year. It means the conditions that typically precede growth—tight supply, rising demand, demographic tailwinds—are currently present in that suburb. Think of it as measuring potential energy rather than predicting specific outcomes.
The update frequency: Unlike annual reports or quarterly snapshots, the Growth Forecast updates weekly as new transaction data comes in. This means a suburb's position can change as market conditions evolve. Regular checking matters. Historical Growth: The Backward-Looking Metrics
10-Year Compound Annual Growth Rate
This metric shows how the suburb has performed over the past decade. It's useful for understanding consistency—has the suburb grown steadily, or in volatile bursts?
The trap is assuming past performance predicts future results. Sometimes it does; strong suburbs tend to remain strong. But sometimes the best historical performers are due for mean reversion—they've captured all the easy growth and future gains will be harder to come by.
Use 10-year growth to understand the suburb's track record, but don't select suburbs based solely on this metric.
3-Year Growth
Compare this to the 10-year figure to understand recent momentum.
- 3-year higher than 10-year: Growth has accelerated recently. The suburb might be "discovered" and gaining attention. Good for momentum, but check if you're late to the party.
- 3-year lower than 10-year: Growth has slowed. Could indicate the suburb is cooling off, or could indicate a buying opportunity if the fundamental drivers are still present.
- 3-year roughly equal to 10-year: Consistent performer. Less exciting, but potentially more predictable.
Supply and Demand Indicators
Rental Percentage
This shows what proportion of properties in the suburb are rented versus owner-occupied.
Conventional wisdom says lower rental percentage is better—owner-occupiers take better care of properties, create more community stability, and historically correlate with stronger capital growth.
But here's the contrarian view: if everyone's looking for low-rental-percentage suburbs, everyone's competing for the same properties. That competition bids up prices and reduces potential returns.
Some investors deliberately target higher-rental-percentage areas because there's less competition. The key is understanding what you're choosing and why, not blindly following conventional metrics.
Vacancy Rate
For rental investors, this is critical. Vacancy rate shows what percentage of rental properties are sitting empty.
- Below 2%: Extremely tight rental market. Landlords have pricing power, tenants have few options. Good for cash flow.
- 2-3%: Healthy rental market. Reasonable balance between landlord and tenant.
- Above 3%: Softening rental market. Might indicate oversupply, population decline, or other concerns.
High vacancy rates are a red flag for rental investors but might be less relevant if you're buying purely for capital growth.
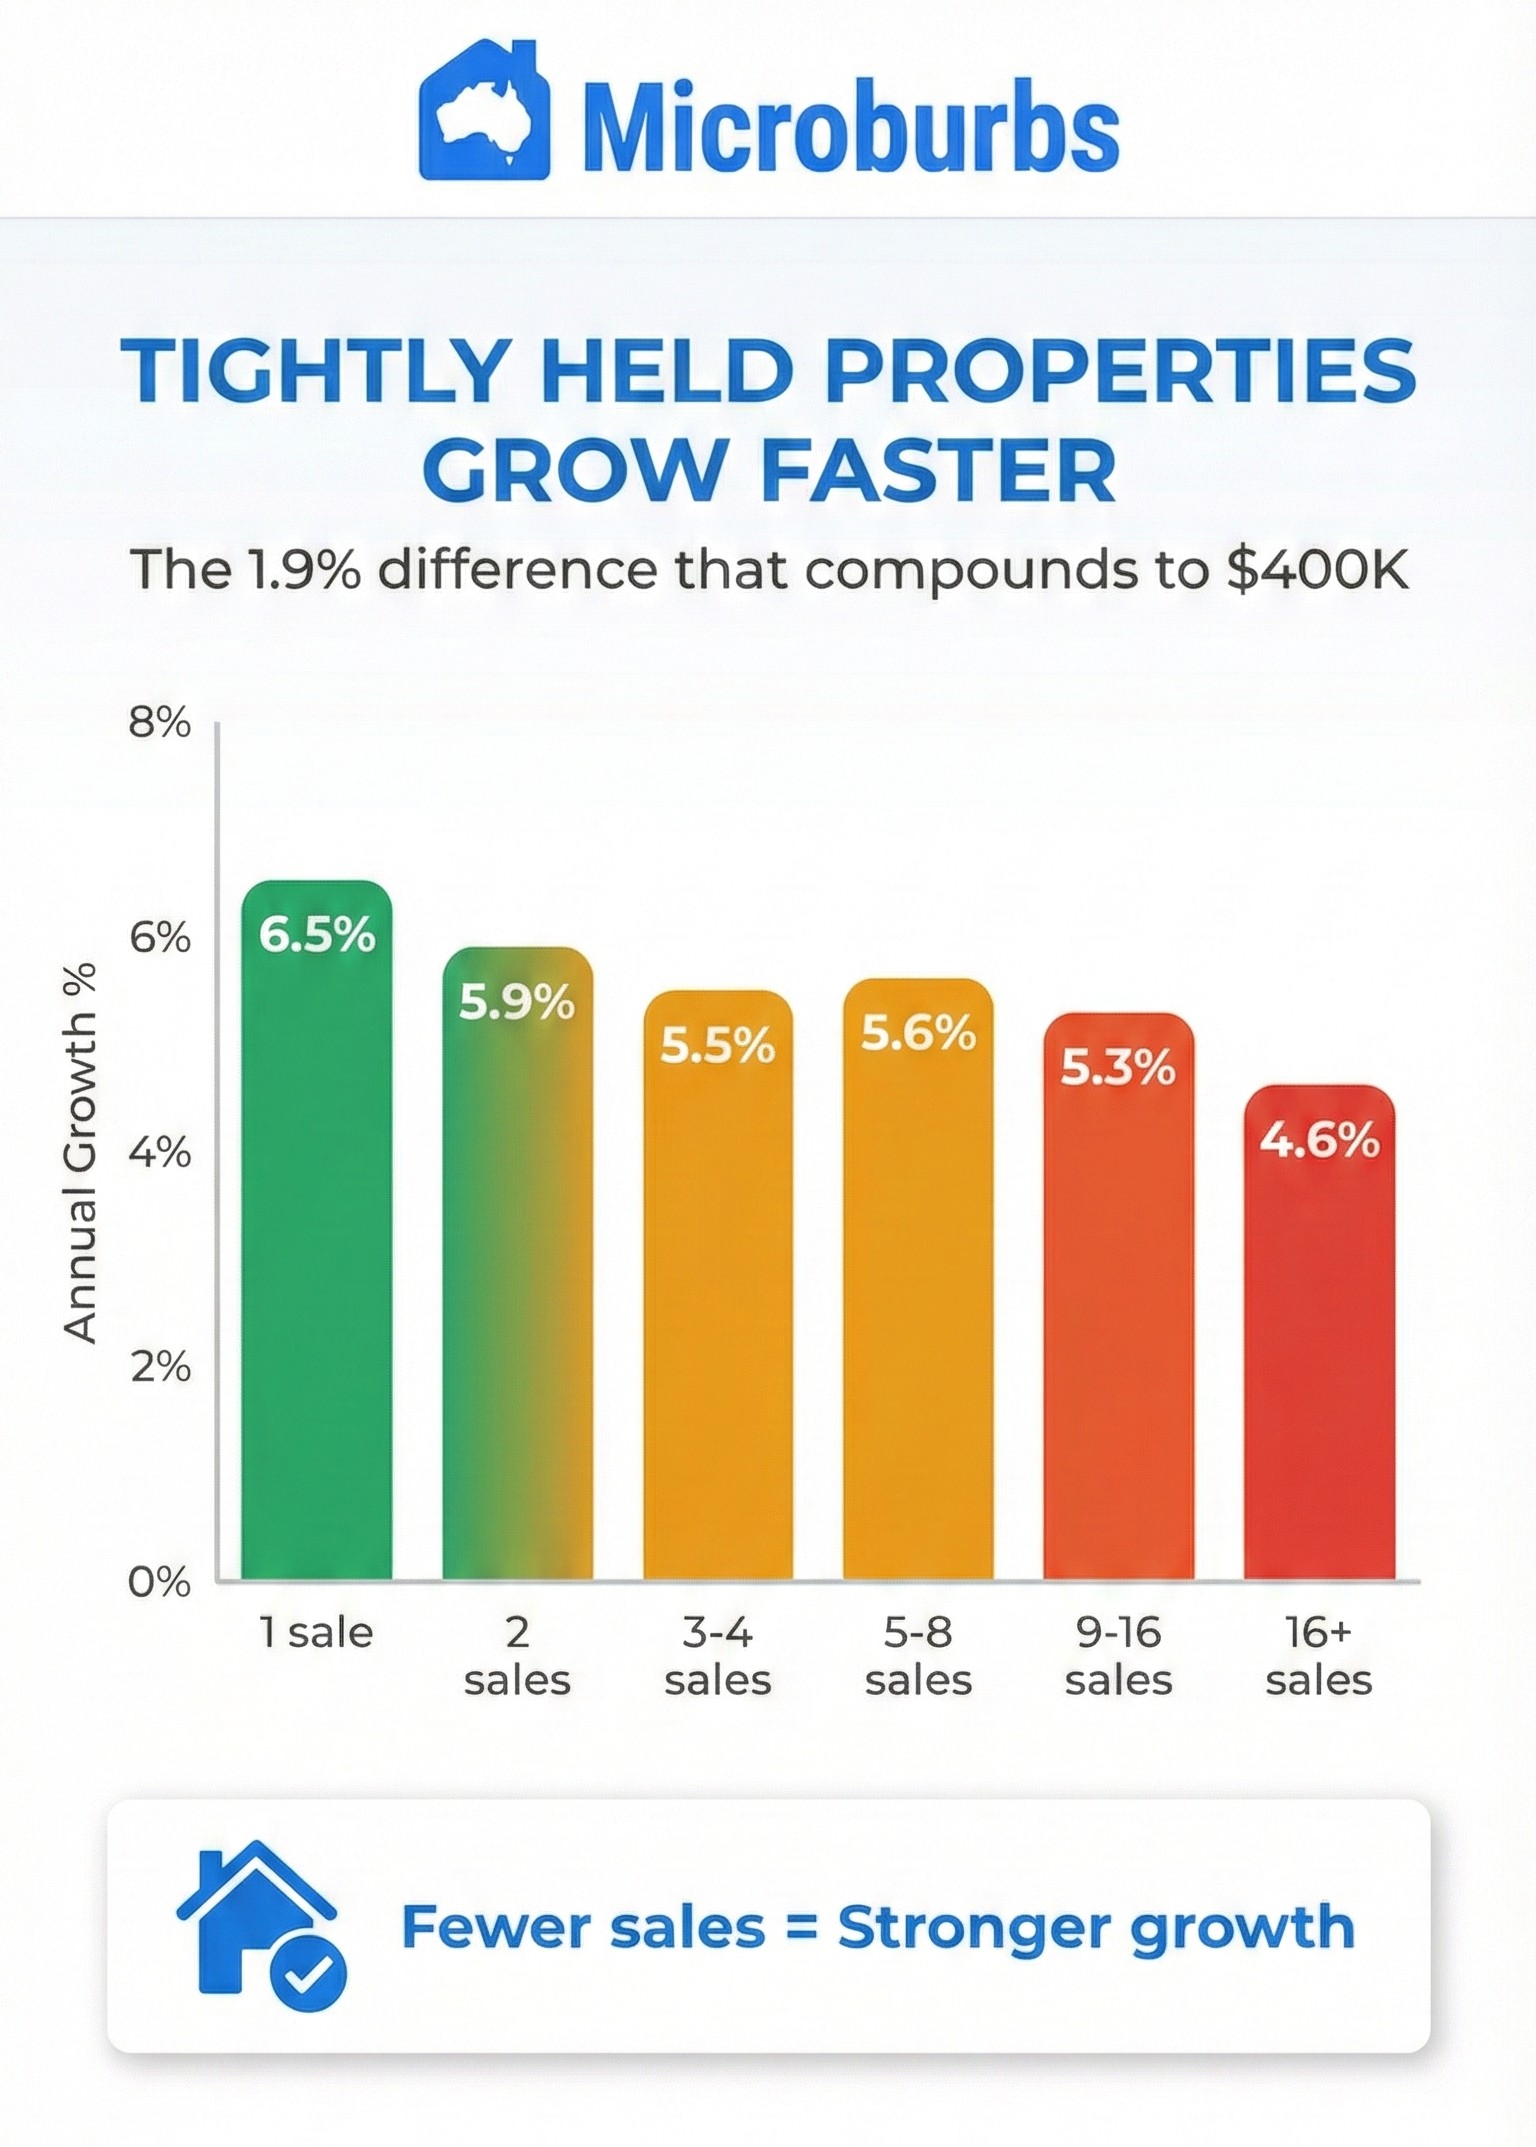
Stock on Market
This measures how many properties are currently listed for sale as a percentage of total properties in the suburb.
- Low stock: Supply constrained. Fewer properties available means less competition among sellers, which supports prices.
- High stock: More properties available. Could indicate motivated sellers, oversupply, or a market cooling off.
Like vacancy rate, context matters. High stock in a rapidly growing suburb might just mean lots of investors taking profits. High stock in a stagnant suburb might indicate fundamental problems.-----Building Your Shortlist: The Practical Process First Pass: Eliminate Red Flags
Once you have your filtered results sorted by Growth Forecast, scan for obvious problems:
- Extremely high vacancy rates (above 4-5%): Suggests rental market distress
- Negative recent growth: The suburb is going backwards
- Very high stock on market: Potential oversupply or seller desperation
- Mismatch between 3-year and 10-year growth that you can't explain
These aren't automatic disqualifiers, but they're signals to investigate further before adding to your shortlist. Second Pass: Identify Promising Candidates
Look for suburbs that show:
- Strong Growth Forecast relative to peers
- Reasonable historical growth (consistency matters)
- Manageable vacancy rates if rental return matters to you
- Low-to-moderate stock levels indicating supply constraints
- Metrics that align with your investment thesis
Select 5-10 suburbs that look promising. Don't try to narrow to one or two at this stage—you don't have enough information yet. The Common Mistake: Over-Optimising at Step 1
The biggest error investors make in Suburb Finder is spending too long trying to pick the "perfect" suburb from aggregate statistics.
Here's the reality: suburb-level statistics hide enormous variation within the suburb. A suburb with a $1 million median might have pockets at $750,000 and pockets at $1.5 million. A suburb with "moderate" growth might have streets that have grown 100% and streets that have grown 10%.
You cannot know if a suburb works for you until you examine pocket-level data. Suburb Finder gets you to a shortlist. Step 2 (Suburb Reports) is where you determine which parts of those suburbs actually fit your criteria.
If you're spending hours debating whether Suburb A or Suburb B has the better Growth Forecast, you're optimising the wrong thing. Put both on your shortlist and let the pocket-level analysis in Step 2 guide your decision.-----What You Should Have After Step 1
At the end of the Suburb Finder process, you should have: A Documented Shortlist
5-10 suburbs that meet your basic criteria:
- Within your budget range (or slightly above, to capture below-median pockets)
- In your acceptable geographic area
- Showing positive Growth Forecast indicators
- Without obvious red flags in key metrics
An Understanding of Each Suburb's Position
For each shortlisted suburb, you should know:
- Its Growth Forecast score and what that implies
- Its historical growth pattern (accelerating, decelerating, or consistent)
- Its rental market dynamics (if relevant to your strategy)
- Its supply situation (constrained or abundant)
Questions to Answer in Step 2
For each suburb, you should have specific questions:
- Where within this suburb fits my actual budget?
- Are there pockets with concerning risks (flood, bushfire, etc.)?
- Which areas have the strongest growth within the suburb?
- What's the street-level variation in quality and price?
-----The Mindset Shift
Suburb Finder represents a fundamental change in how you approach property research:
Old approach: "I've heard Suburb X is good. Let me see if that's true."
New approach: "Of all Australian suburbs, which ones have the characteristics I'm looking for?"
The first approach limits you to your existing awareness. The second approach lets the data guide you to opportunities you might never have discovered otherwise.
You're not looking for the suburb with the best story or the most media buzz. You're looking for suburbs where the data supports your investment thesis—regardless of whether you've heard of them before.-----Moving to Step 2
With your shortlist of 5-10 suburbs, you're ready for the next phase: drilling into pocket-level data to understand which parts of each suburb actually work for your criteria.
This is where the real differentiation happens. Most investors who make it to a shortlist of promising suburbs still buy in the wrong pockets—because they never do the micro-level analysis that reveals where the true opportunities (and true risks) are located.
Step 2: Suburb Reports answers the question "Where in this suburb is suitable?" It's where broad potential becomes specific opportunity.-----Next in this series: Step 2: Suburb Reports - Finding the Right Pockets Within Your Target Suburbs