Why Chasing 'Hot Pockets' Could Cost You: Mean Reversion at the Micro Level
If you've ever looked at a suburb report and thought 'that pocket has grown 15% in two years, I should buy there', you're not alone. It feels logical. But our analysis of 380,000 actual property transactions suggests you might be making an expensive mistake.
First, let's talk geography
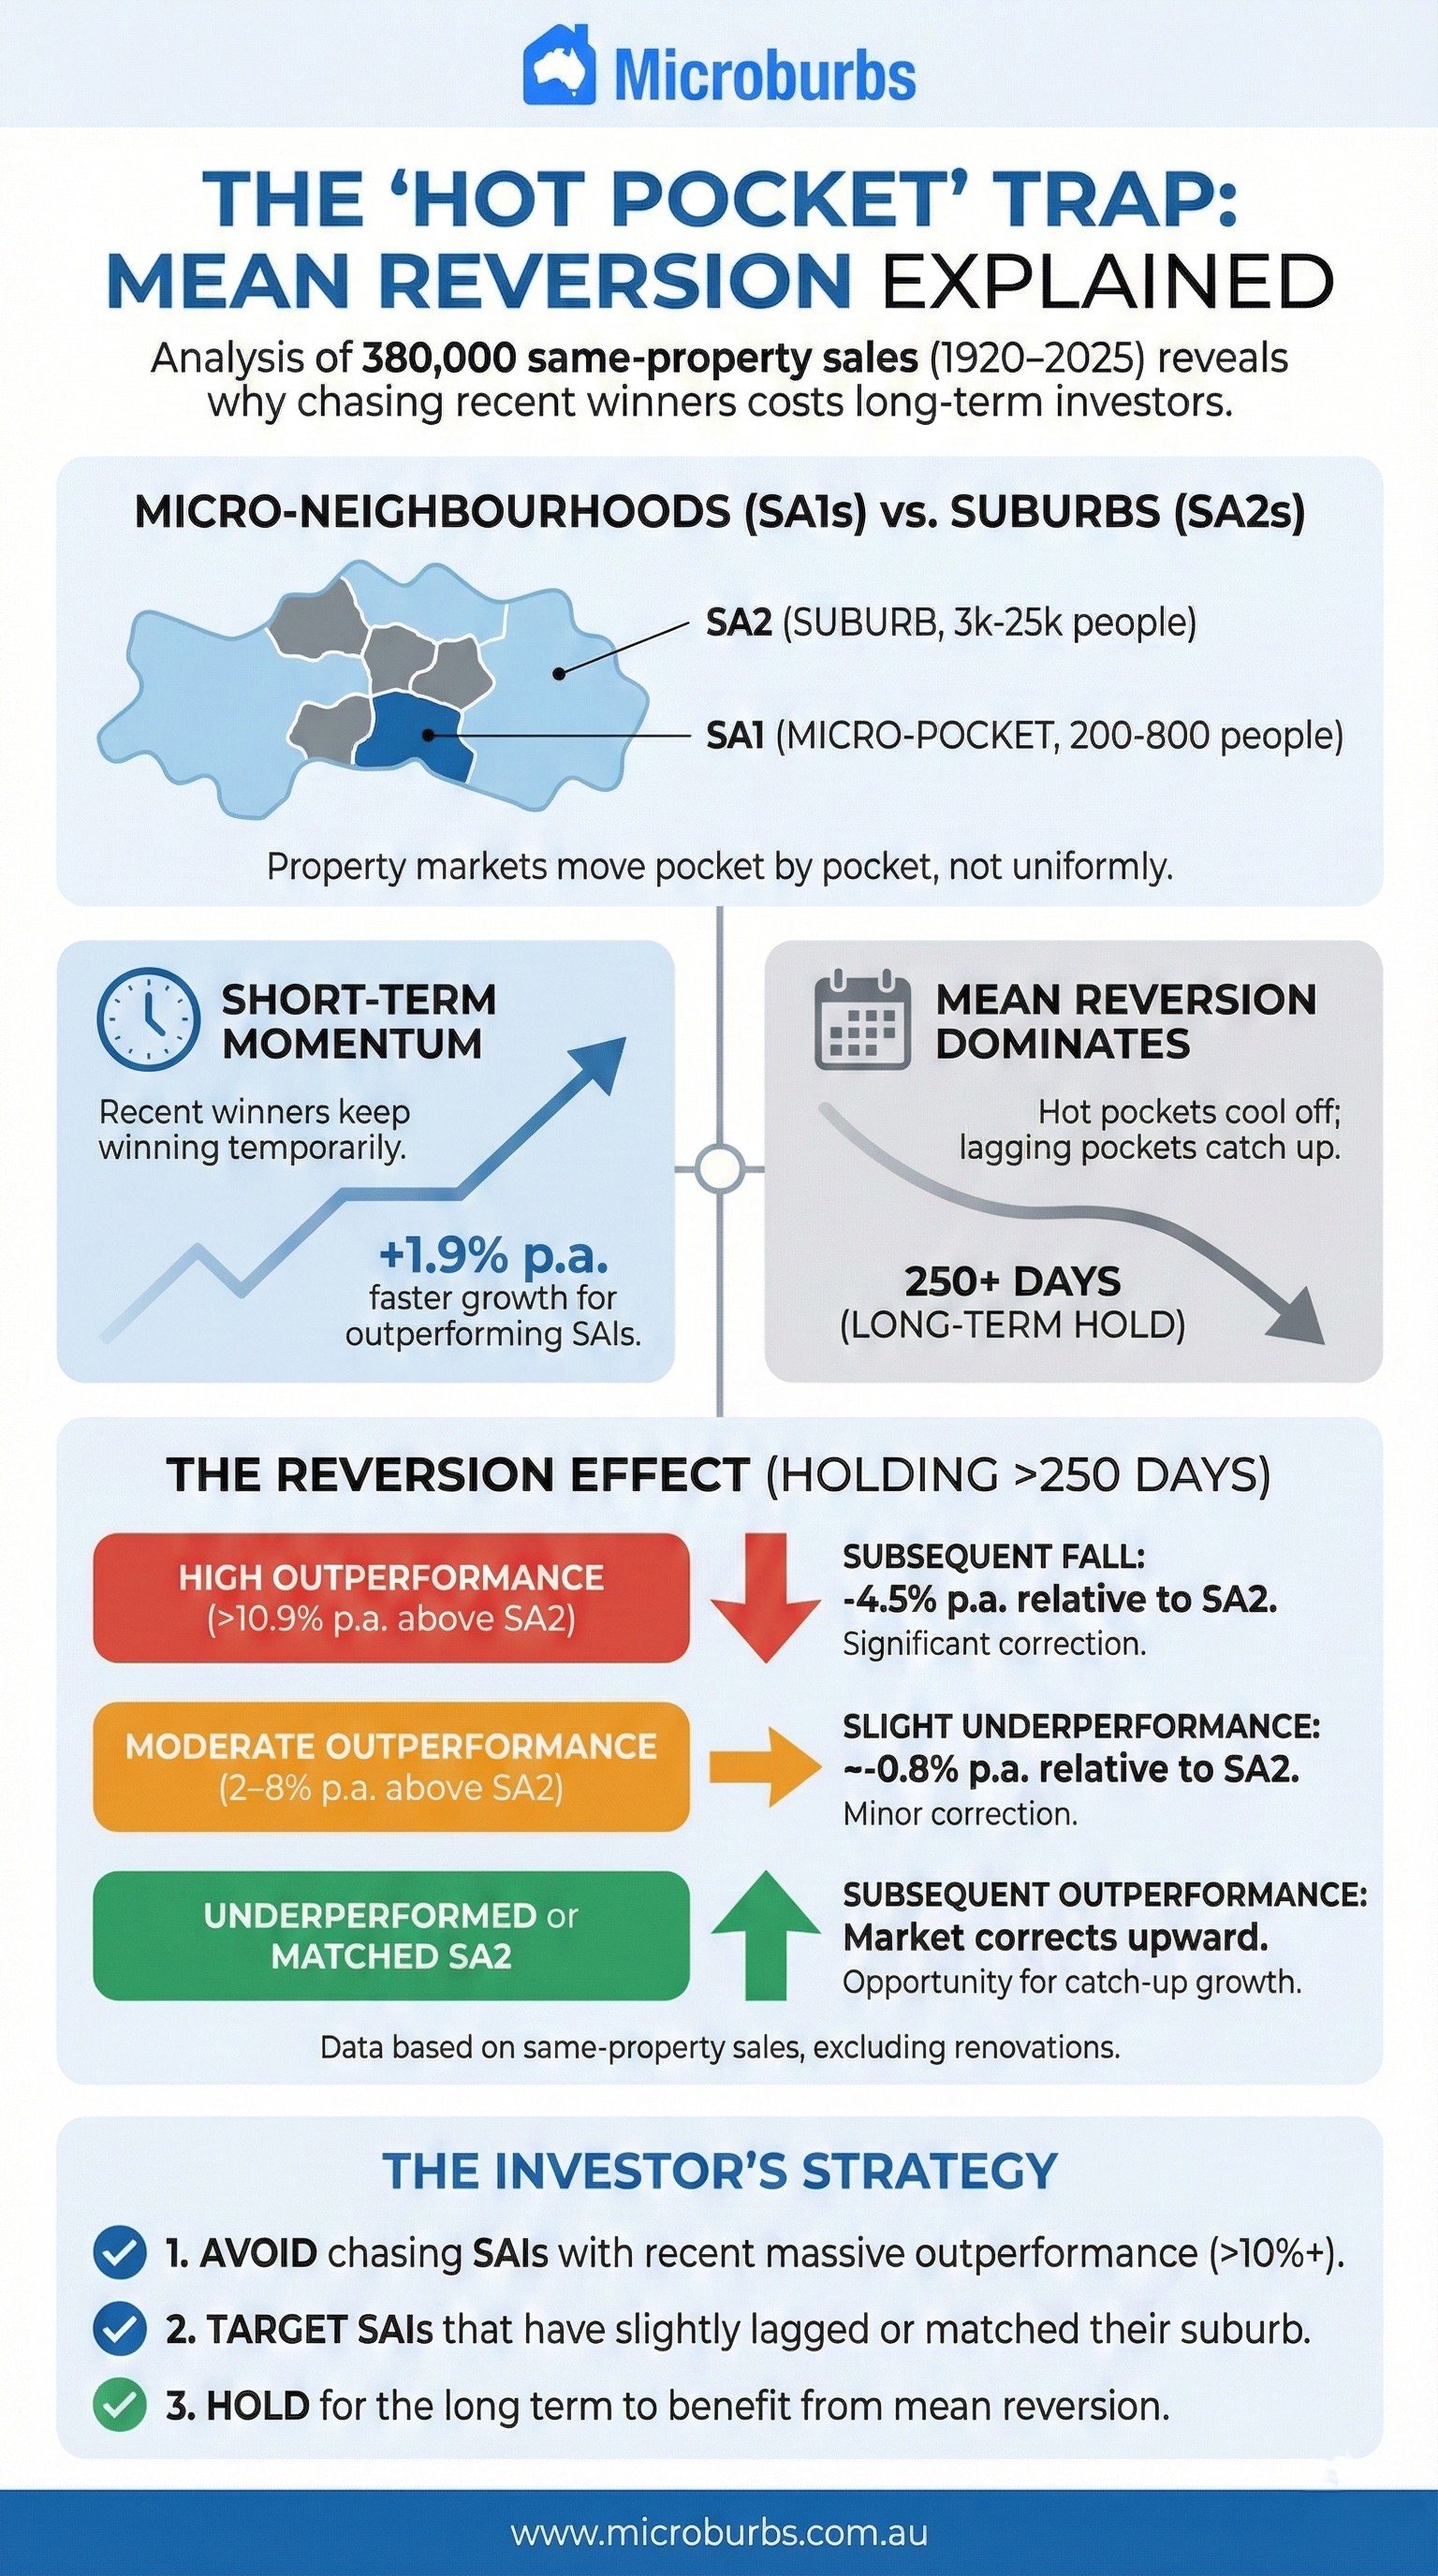
Australia is divided into statistical areas by the ABS (Australian Bureau of Statistics). You've probably heard of SA2s, which roughly correspond to suburbs, typically containing 3,000 to 25,000 people.
But within each SA2 are smaller units called SA1s. These are the real 'micro-neighbourhoods', containing just 200 to 800 people. Think of them as individual pockets within a suburb: a few streets around a park, the blocks near the station, or the older section up the hill.
When people talk about 'some parts of the suburb doing better than others', they're really talking about SA1-level differences. And that's where things get interesting.
What the data shows
We analysed 380,000 same-property sales across Australia from 1990 to 2025. These are properties that sold, then sold again, with renovations excluded. This matters because same-property sales give us cleaner growth data than median prices, which can be skewed by what happens to sell in any given period.
We then compared how each SA1 performed relative to its broader SA2 suburb, and what happened next.
The mean reversion pattern
Here's what we found for properties held beyond 250 days:
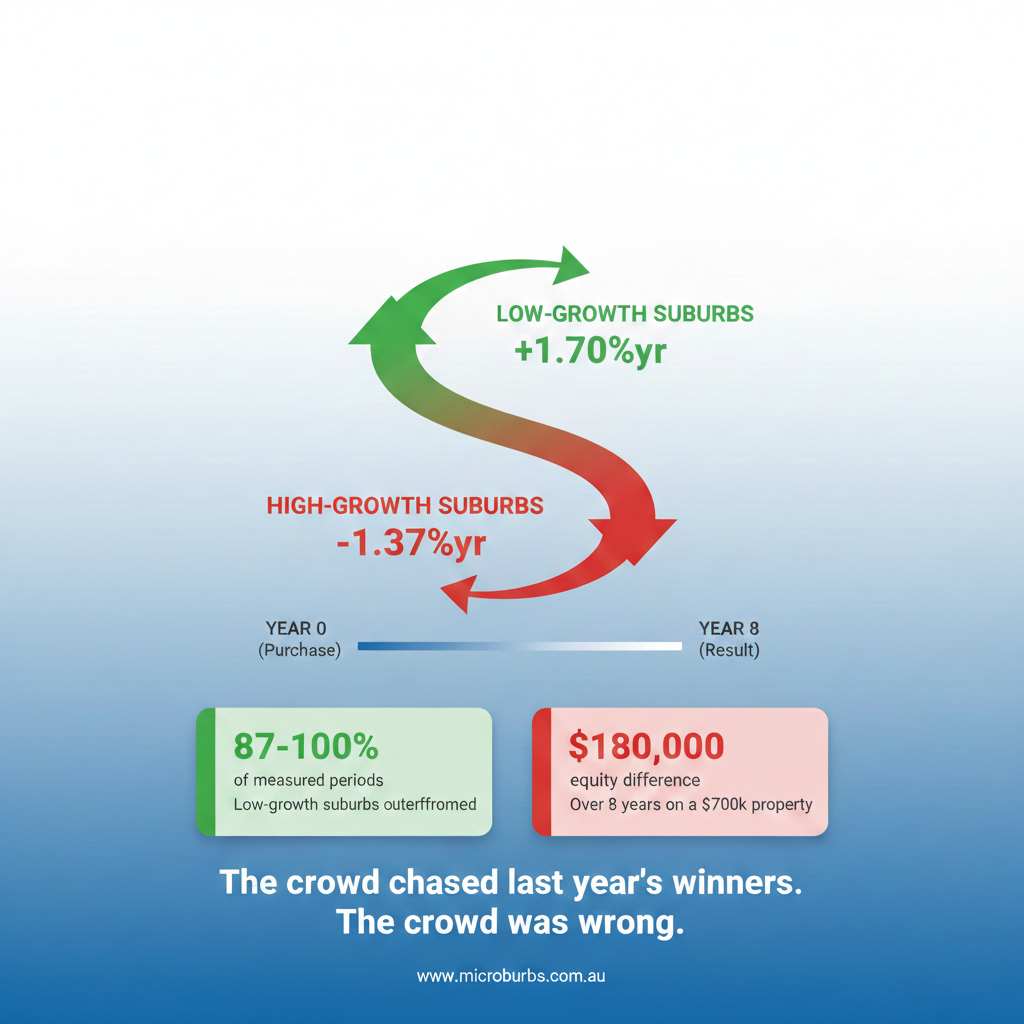
SA1s that underperformed or matched their SA2 subsequently outperformed over the next two years. The market corrected upward.
SA1s that outperformed their SA2 by 2-8% annually subsequently underperformed by about 0.8% per year. Not dramatic, but consistent.
SA1s that outperformed by more than 10.9% annually subsequently fell back by 4.5% per year relative to their SA2. That's a meaningful correction.
In other words, the 'hot pockets' cooled off, and the 'lagging pockets' caught up.
But what about momentum?
Here's where it gets nuanced. Mean reversion doesn't kick in immediately.
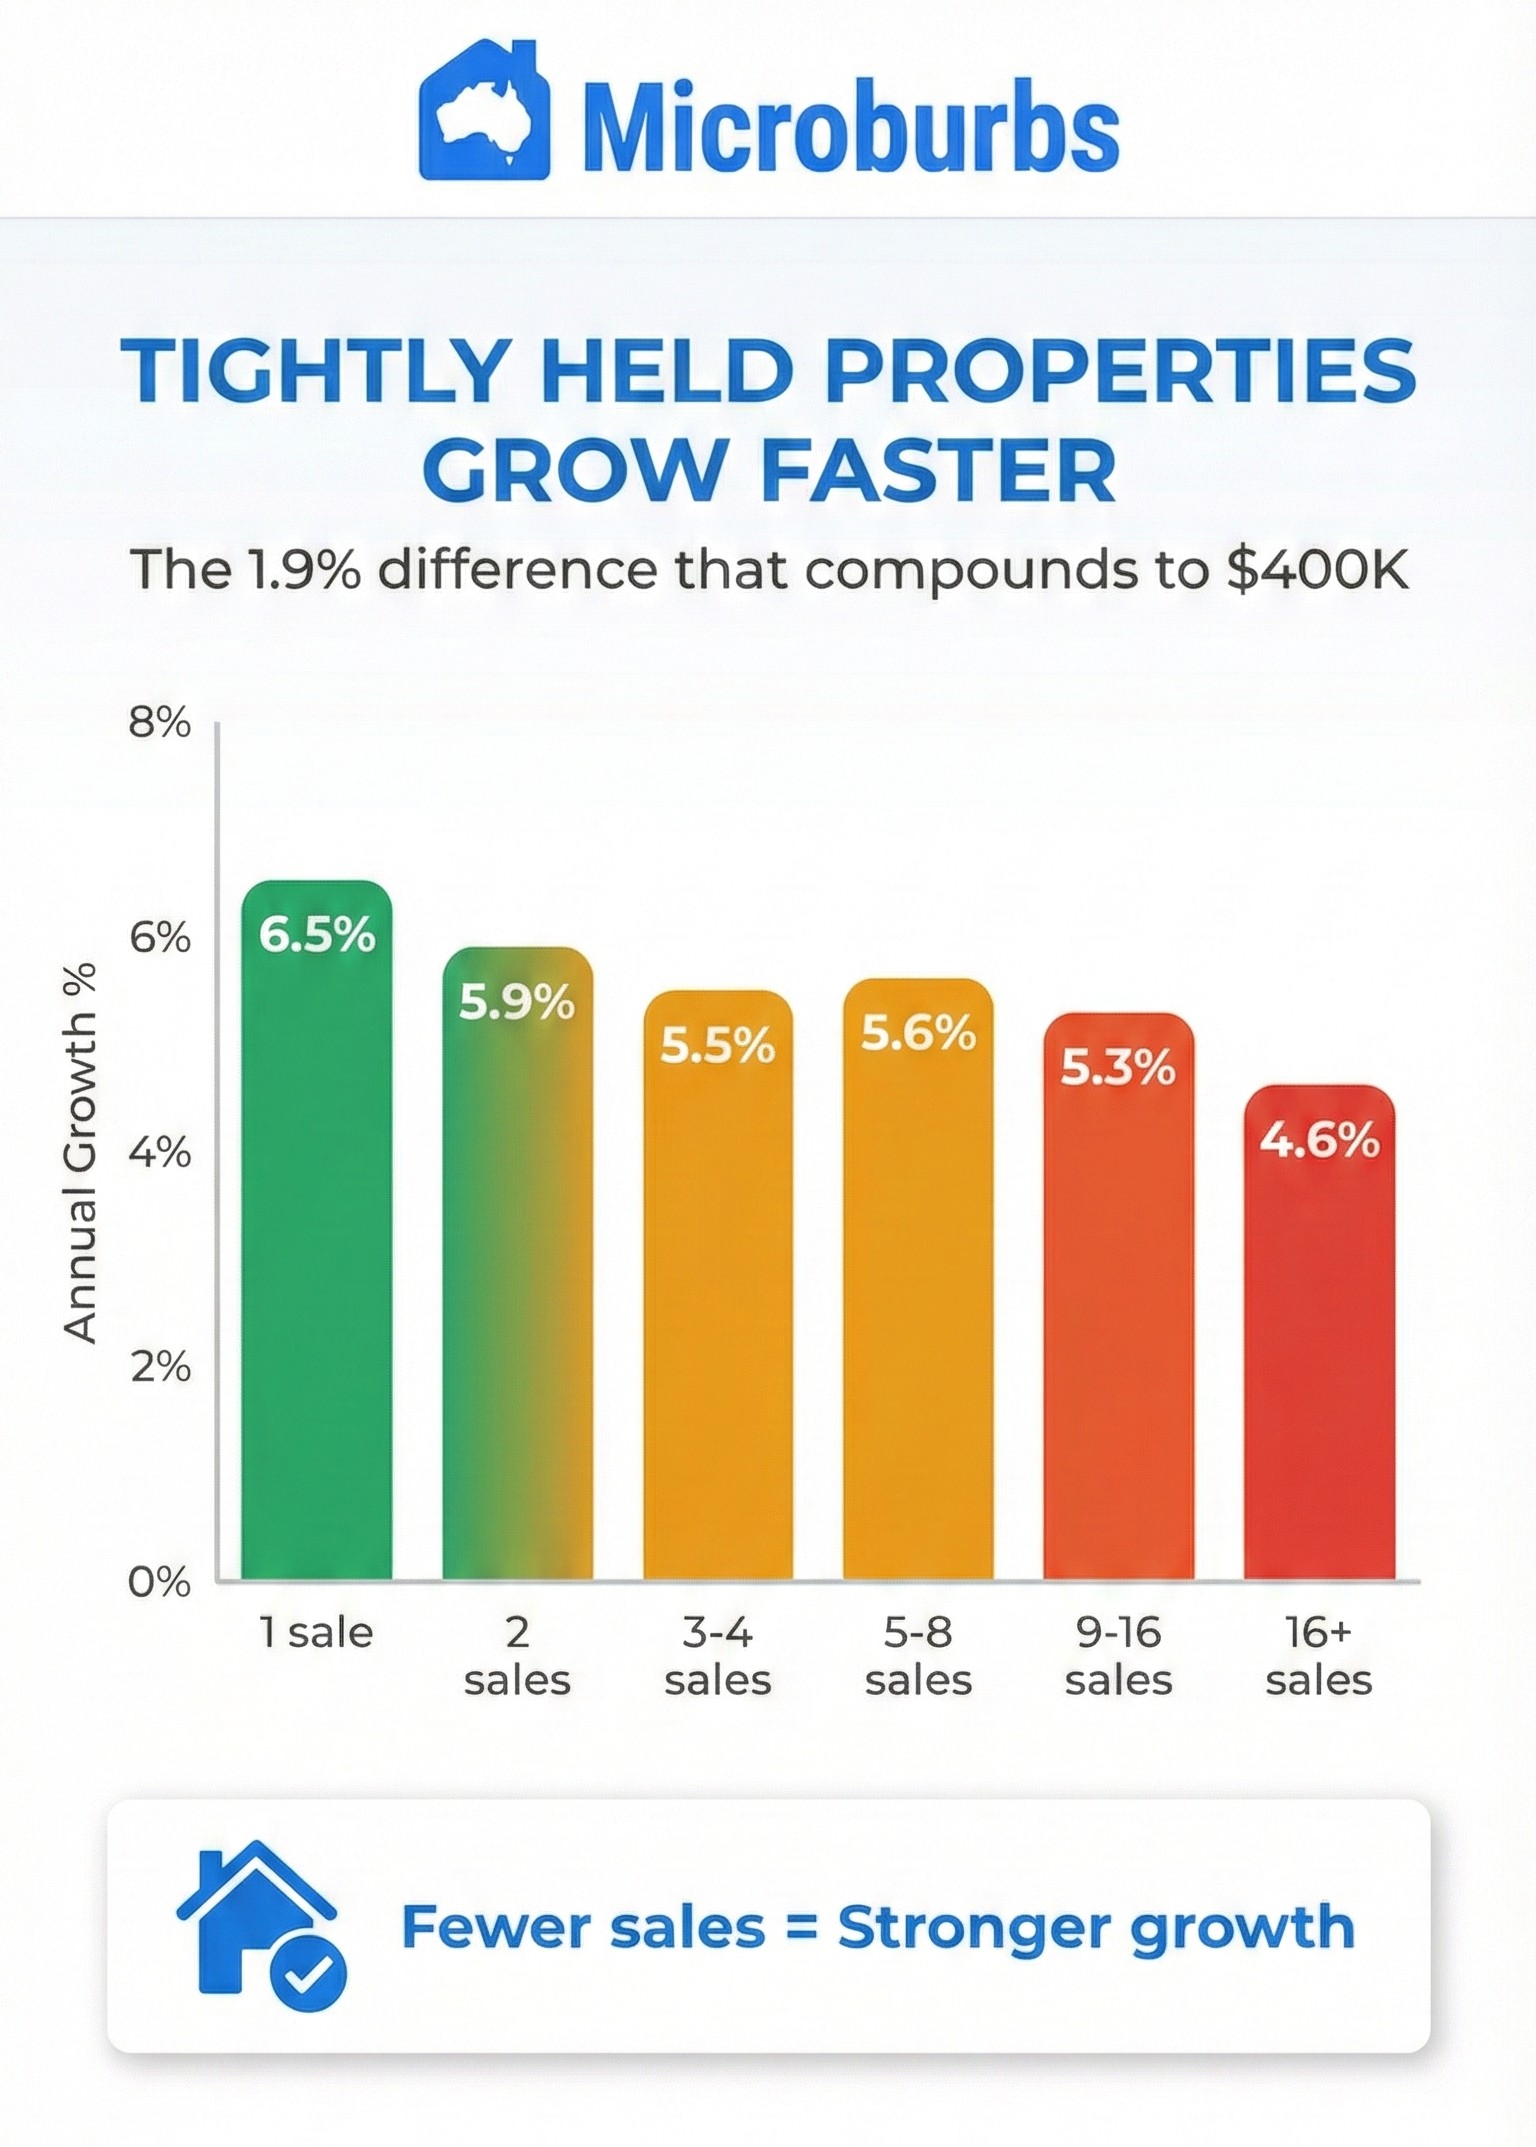
In the first 250 days after a property purchase, momentum is still at play. SA1s that had been outperforming continued to grow at around 1.9% per annum faster than their neighbours.
So if you're planning to flip within eight months, momentum might work in your favour. But for most investors holding for years, mean reversion is the dominant force.
We specifically chose the 250-day threshold in our analysis because that's where momentum gives way to mean reversion. Before that point, recent winners keep winning. After it, they start giving back their gains.
Quantifying Short-Term Momentum: The Upper-Quartile Signal
Our threshold research provides a precise way to measure momentum using upper-quartile buy price growth—the growth rate at the 75th percentile of property sales in a suburb over the past year.
This metric captures whether the top end of a local market is accelerating or decelerating, which is a stronger momentum signal than median growth alone. Here's what we found over a 2-year forward period:
Why this matters for your investment strategy
This analysis suggests a counterintuitive approach: rather than chasing the hottest micro-pockets, consider areas that have lagged their broader suburb.
If an SA1 has grown more slowly than its SA2 over the past two years, the data suggests it's more likely to catch up over the next two. Conversely, if a pocket has significantly outperformed, some of those gains may evaporate.
This doesn't mean you should buy anywhere that's underperformed. Location fundamentals still matter. But when comparing two similar pockets, the one that's 'lagged behind' might actually offer better forward value.
Why nobody else does this analysis
Most property data providers work with CoreLogic aggregates or similar sources. These are suburb-level (SA2) medians at best.
Analysing at the SA1 level requires granular transaction data and significantly more computational work. But that's exactly where the actionable insights live. Because property markets don't move uniformly across a suburb. They move pocket by pocket.
The practical takeaway
If you're a long-term investor (holding for more than a year), the data suggests:
- Be cautious of SA1s that have significantly outperformed their suburb recently. A 10%+ annual outperformance often reverses.
- Look for SA1s that have slightly underperformed or matched their SA2. These tend to catch up.
- Don't ignore momentum entirely if you're buying and selling within eight months. But for typical hold periods, mean reversion matters more.
- Use same-property growth data where possible. Median price movements can mislead you about what's actually happening to property values.
The hot pocket today might be the underperformer tomorrow. And the quiet pocket that nobody's talking about? That might be exactly where the value is building.
The Bottom Line
The hot pocket today might be the underperformer tomorrow. And the quiet pocket that nobody's talking about? That might be exactly where the value is building.